
Lab 10
Pre-Reading Quiz
Please fill out the pre-reading quiz on Canvas at the beginning of class!
Learning Objectives
- Know how to use data APIs
- Know how to use the JS library jQuery to load data and to select DOM elements
- Know how to create interactive maps with the JS framework Leaflet.js
- Load tiles from different providers
- Draw markers, polygons, circles, etc.
- Import GeoJSON data and render it on the map
Prerequisites
- You have watched the video jQuery Ajax Tutorial #1 - https://www.youtube.com/watch?v=fEYx8dQr_cQ
- You have read the article AJAX and getJSON() - https://medium.com/@KDweber89/ajax-vs-getjson-ca910fa6854e#.ovt65poqs
Data Sources
In the past few weeks you have worked only with static datasets. Either with small arrays or external CSV, JSON or GeoJSON files. The advantage of storing data locally (i.e., in files or in your own database) is that your application is independent from other services and the data will not change.
But very often the data sources of visualizations are dynamic and you have to deal with a data stream instead of a static dataset. Sometimes the data is too large and you have to send a query to an external service (data API) to get the specific information that is currently needed.
Data APIs allow you to programatically access a wealth of open data resources from governments, NGO’s and companies. Especially with the evolution of e-government and open data initiatives worldwide, more and more APIs are made available to the general public.
During this lab you will learn how to access these web services and how to visualize the requested data. In contrast to the last weeks you don’t have to deal with D3 today. Instead, you will learn how to create interactive maps with the JavaScript library Leaflet. This powerful library has been established as an open source alternative to Google Maps to create zoomable, interactive maps. But you can also render D3 on top of a Leaflet map or create linked D3/Leaflet views for a more comprehensive visualizations.
Example
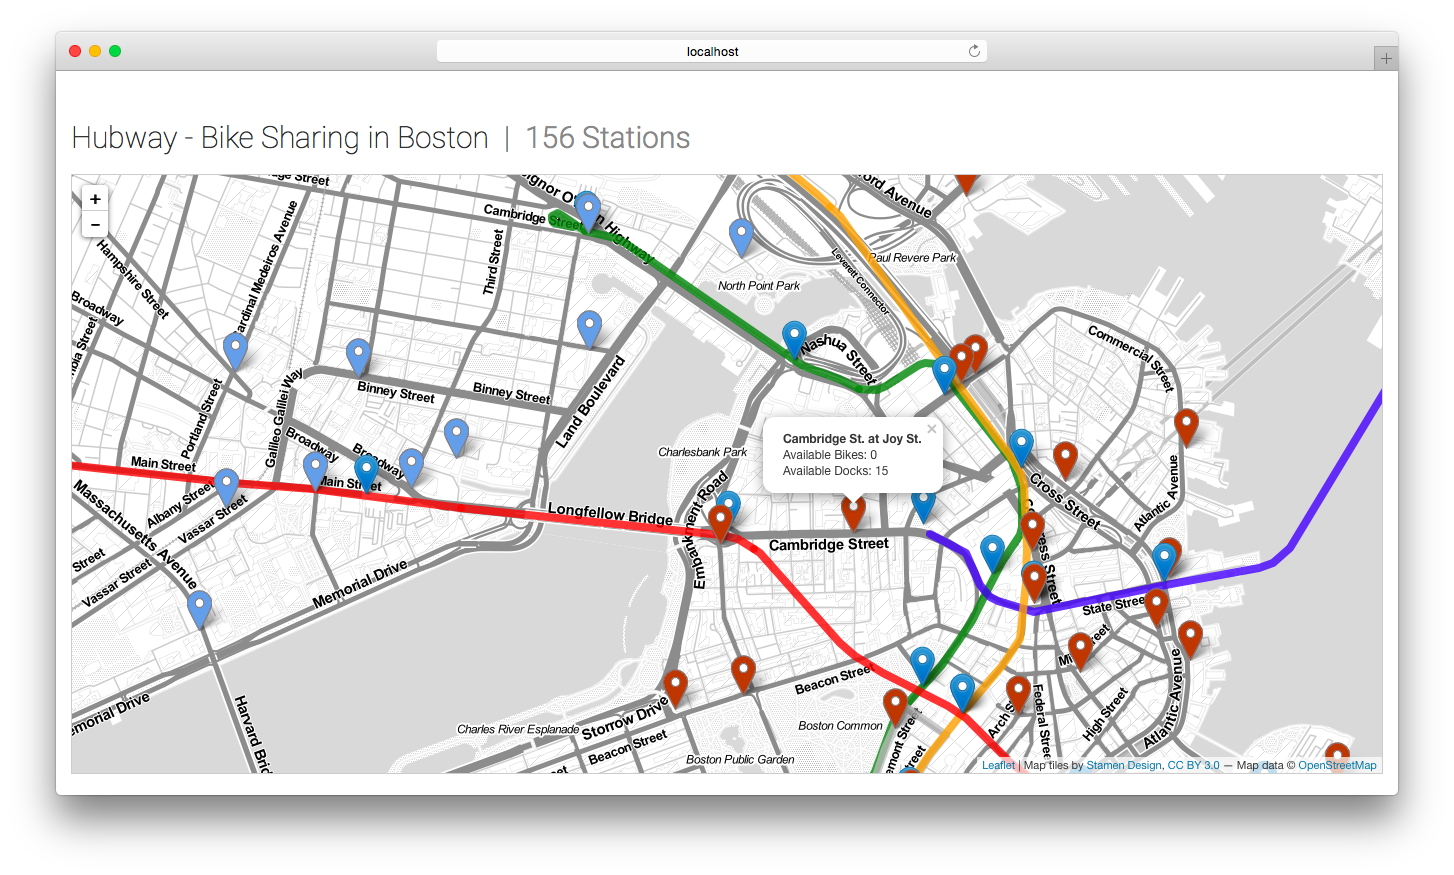
The activities of today’s lab will guide you through the implementation of an interactive map. You will have to visualize stations of Boston’s bike-sharing network Blue Bikes (formerly known as Hubway).
A major aspect of these bike-sharing networks is the dynamic “fill level” of the individual stations. The number of bikes available in a station is important for the network operator, who must take care of a balanced network, as well as for the consumer, who wants to rent a bike. While the operator is probably more interested in the big picture, the consumer wants to know if there is an available bike at the start and an avaialable docking station at the end of the route.
In the following activities you will have to create a basic overview map to help the user get a rough impression of the local bike-sharing network.
Hubway provides an XML feed with live-data of the current filling levels: https://member.bluebikes.com/data/stations/bikeStations.xml
Preview
Data APIs
HTTP GET request in JavaScript
In the last weeks you have learned how to load external files with D3. The built-in functions like d3.json() or d3.csv() made it pretty easy to load a dataset into the browser’s cache. During the following activities you will have to visualize dynamic data from Hubway Boston, our local bike sharing organisation.
As an example, let’s do a dynamic data request for the foreign exchange rates for U.S. dollars. Because these rates typically change multiple times a day, this is a very good case for using a web service. There is a public API (fixer.io) which returns the exchange rates, formatted as a JSON object (Note: The fixer.io API has recently been updated and now requires users to create accounts to request their data. The following code is just a general example of how to request data from a public API.)
d3.json("http://api.fixer.io/latest?base=USD", function(error, jsonData){
	console.log(jsonData);
});
API response:
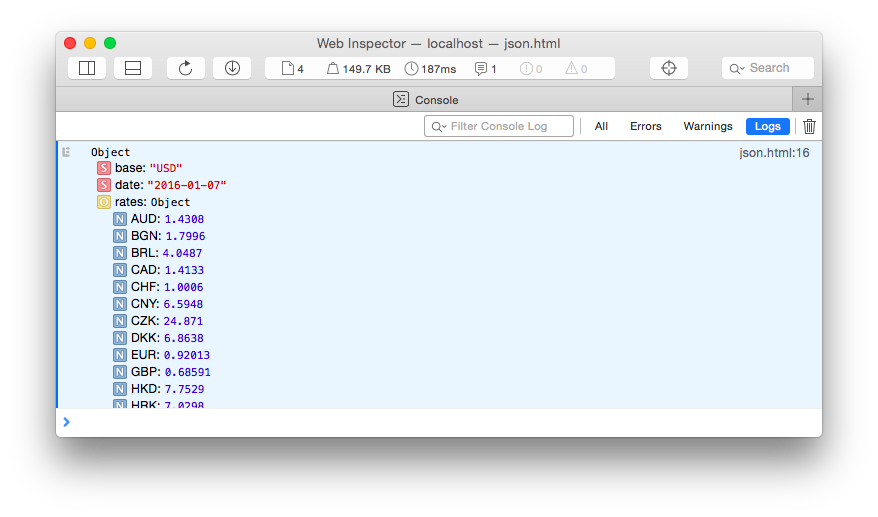
The request with d3.json() led to the desired result and, apart from the given URL, there is no difference to loading JSON data from the local filesystem.
Let’s adapt the example and request data from Divvy Bikes, the bike sharing company in Chicago:
d3.json("https://www.divvybikes.com/stations/json", function(error, jsonData){
	console.log(jsonData);
});
API response:
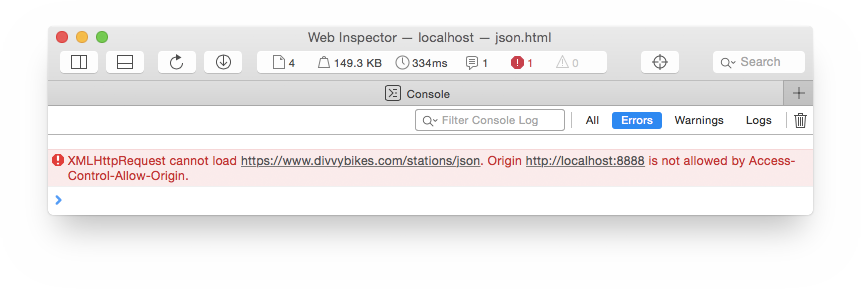
This API request leads to an error, although nothing fundamental has changed. When you look at the error message you will notice that we are trying to request data from a foreign server (cross-domain).
But why did it work for some public APIs? Because the cross-origin resource sharing policy depends on the server, which is providing the data. Generally, it’s not allowed to get access with JavaScript to these resources, but the provider (server with data API) can define exceptions.
Resource sharing can cause major security risks. Therefore, these kinds of requests are usually forbidden and you have to consider these built-in safety mechanisms.
There are several ways to request data and to overcome the cross-domain restrictions:
-
If the server supports JSONP you can send an AJAX request and you can process the result like any other JSON response. JSONP stands for “JSON with Padding” and it is a workaround for loading data from different domains. The disadvantage is, that is only rarely supported.
-
If you have access to the server that is controlling the remote data, you can change the cross-domain limitations or provide the data in JSONP format.
-
You could also manually copy the data to your server, but in our case this cannot be considered, because we want to access dynamic data from an external web service.
-
You can set up a proxy server that acts as intermediary between your JavaScript application and the remote server. The proxy can be written in any server-side language - like PHP, Python or Java - and therefore can avoid any cross-domain issues.
-
There are also external services, such as the Yahoo Query Language (YQL). You can send a query to YQL which requests the data from the remote server and immediately sends the result, in the desired format, back to your application.
Setting up a server-side proxy means some work and is not directly necessary for our inteded visualization. Therefore, we provide a server with a small PHP script which can be used as an intermediary between your JS application and the API.
You just have to call the proxy URL and pass the URL to your JSON feed as a parameter. If you want to request XML data you have to add the parameter format.
http://michaeloppermann.com/proxy.php?url=URL-TO-JSON-FEED
http://michaeloppermann.com/proxy.php?format=xml&url=URL-TO-XML-FEED
Instead of using D3, like in all our previous examples, you can also send an HTTP request or load data with jQuery.
jQuery Example:
var proxyUrl = "http://michaeloppermann.com/proxy.php?url=https://www.divvybikes.com/stations/json";

$.getJSON(proxy, function(jsonData){
	// Work with data
});
Activity I - Request station data from Hubway
You will notice that in this activity we do not give you as many helpful pointers as in previous labs. We do this with the goal to prepare you for your final projects, where you will have to develop D3 code independently in your groups.
-
Download the template
http://cs171.org/2018/assets/scripts/lab10/template.zip
The template is based on Bootstrap and jQuery
-
index.htmlcontains references to the JS and CSS files. There is also an empty div element (ID:station-map) that should be used as parent container for your map. -
main.jsandstationMap.jscontain only a basic boilerplate. The structure is similar to our previous lab, but with less provided code.
-
-
Send a request to the Hubway XML station feed by using an intermediary web service
main.jsshould contain general scripts, such as data loading and the creation of visualization instances. The jQuery library is available in our template. You can use it so send the request.We suggest you to use our PHP proxy (see instructions above). If you have more experience with web development and you think you can complete the following activities quickly, you can also use the YQL service instead. We have summarized the important points here: http://www.cs171.org/2018/assets/material/cs171-lab10-yql.pdf.
→ Write the response to the web console and analyze the data. Look at the format of the data, what are the fields or data attributes?
-
Extract an array with stations (JSON objects) from the response object
Use the dot-notation to navigate and select the necessary data from the tree. It is easier to further work with a single array, instead of a deeply-nested structure. Do not forget to process your data appropriately (e.g., convert strings to numbers when necessary).
-
Output the number of stations with jQuery
We have integrated an HTML element
(id="station-count")which should contain the number of stations of Boston’s bike-sharing network.Use the jQuery selector to access the element and to output (
.text()or.html()) the current number of stations dynamically. -
Create an instance of
StationMapIn addition to the
main.jsfile we have also included a template for the “visualization object”. It follows the concept of the previous lab (individual, exchangeable and reusable components) and should contain the map implementation.→ Create an instance of this object and pass over the data (JSON-formatted station list) and the ID of the parent container (“station-map”)
You don’t need to implement a map for now, but you can output the data to the web console, to see if it works.
Leaflet
Leaflet is a lightweight JavaScript library for mobile-friendly interactive maps. It is open source, which means that there are no costs or dependencies for incorporating it into your visualization. Leaflet works across all major browsers, can be extended with a huge amount of plugins, and the implementation is straight-forward. The library provides a technical basis that is comparable to Google Maps, which means that most users are already familiar with it.
Downloads, Tutorials & Docs: http://leafletjs.com/
Implementation
Before continuing with the next activity we will give you a short overview of the required steps for creating a Leaflet map.
After downloading and including the necessary files you will just need a few lines of code to create a basic map.
Parent HTML container for the map:
<div id="ny-map"></div>
Initialize the map object:
var map = L.map('ny-map').setView([40.712784, -74.005941], 13);
[40.712784, -74.005941] …corresponds to the geographical center of the map ([latitdue, longitude]). In this example we have specfied the center to be in New York City.
If you want to know the latitude-longitude pair of a specific city or address you can use a web service, for instance: http://www.latlong.net
Additionaly, we have defined a default zoom-level (13). All further specifications are optional and described in the Leaflet documentation.
Add a tile layer to the map:
L.tileLayer('http://{s}.tile.osm.org/{z}/{x}/{y}.png', {
attribution: '© <a href="http://osm.org/copyright">OpenStreetMap</a> contributors'
}).addTo(map);
In this code snippet, the URL “http://{s}.tile.osm.org/{z}/{x}/{y}.png” is particularly important. Leaflet provides only the “infrastructure” but it does not contain any map imagery. For this reason, the data - called tiles - must be implemented by map data providers. That means that we have to choose a provider and specify the source of the map tiles (see URL).
A list of many tile layer examples (that work with Leaflet) is available on this webpage: https://leaflet-extras.github.io/leaflet-providers/preview/
Some of the map providers (e.g., OpenStreetMap, Stamen) made their data completely available for free, while others require the registration of an API key (Google, MapBox, …) and charge fees after exceeding a specific limit.
Examples:
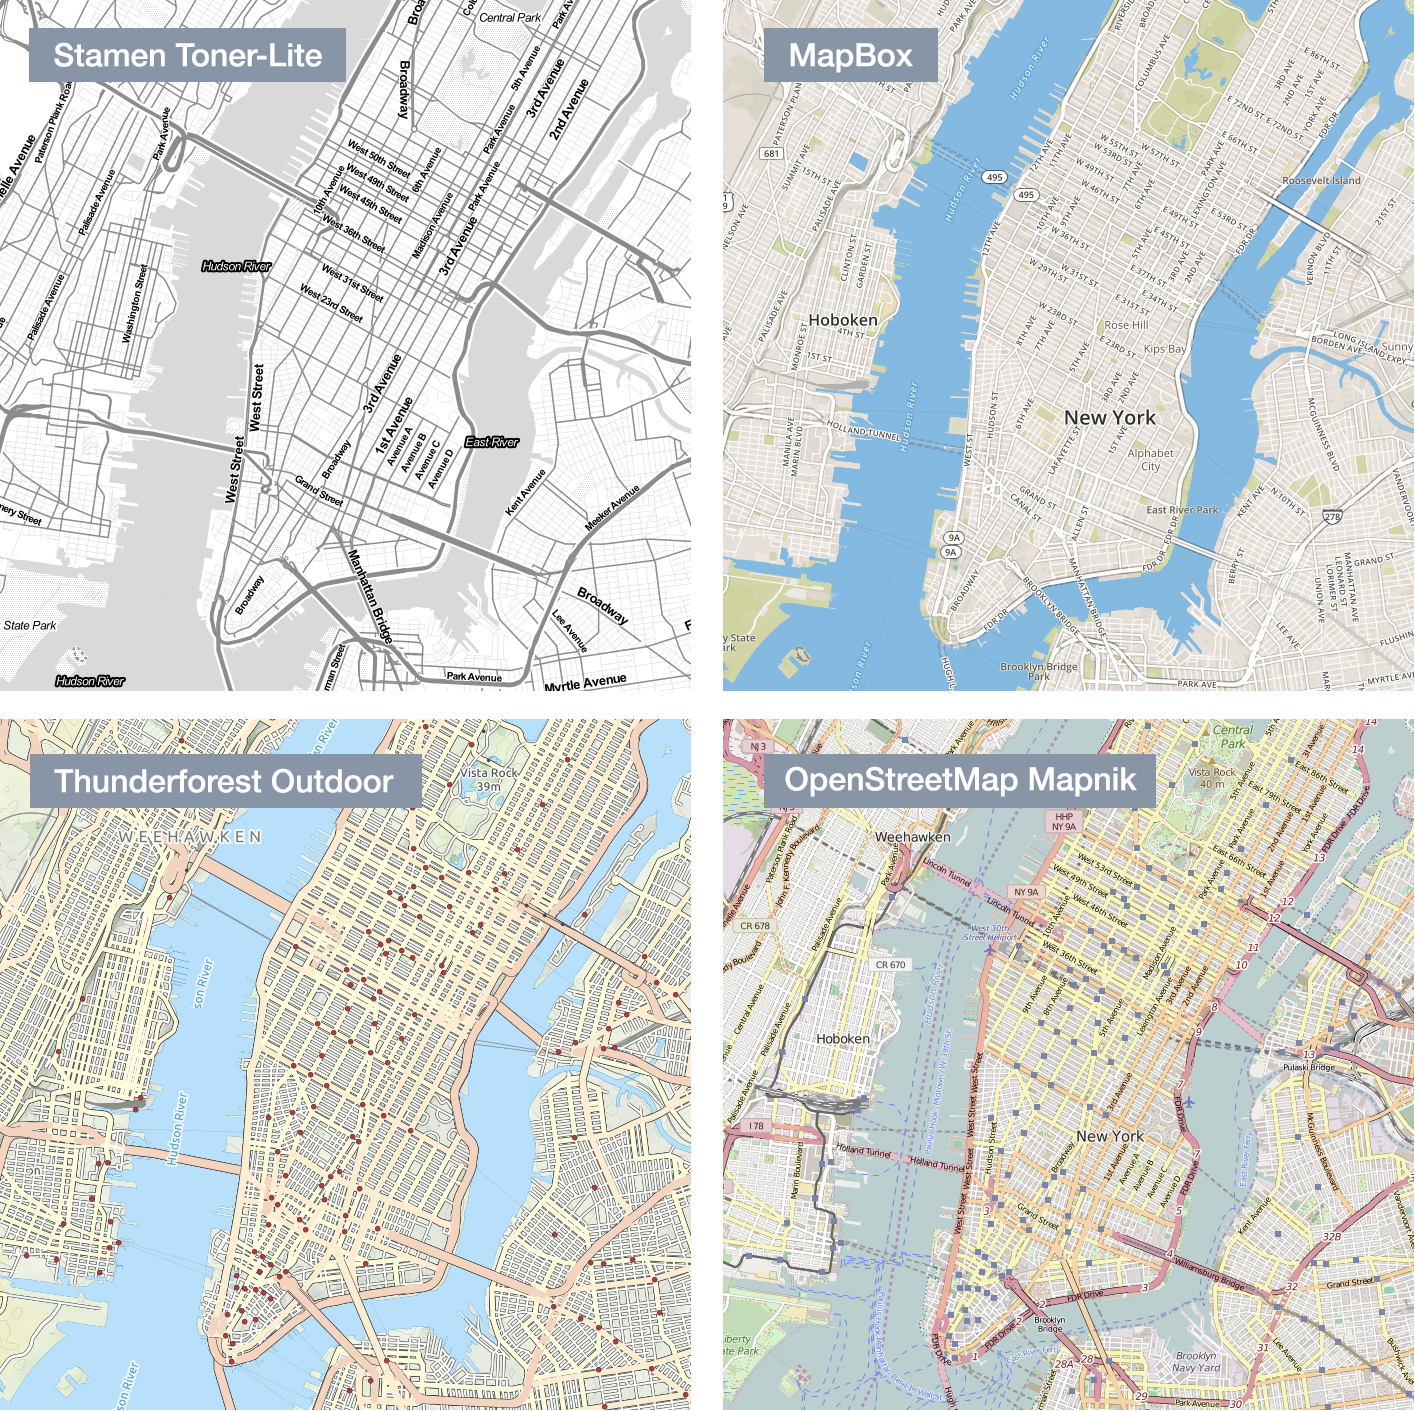
For now, we will use tiles from OpenStreetMap (“http://{s}.tile.osm.org/{z}/{x}/{y}.png”).
After adding a tile layer to the map object, the page still remains empty. You have to make sure that the map container has a defined height.
Specify the size of the map container in CSS:
#ny-map {
	width: 100%;
	height: 600px;
}
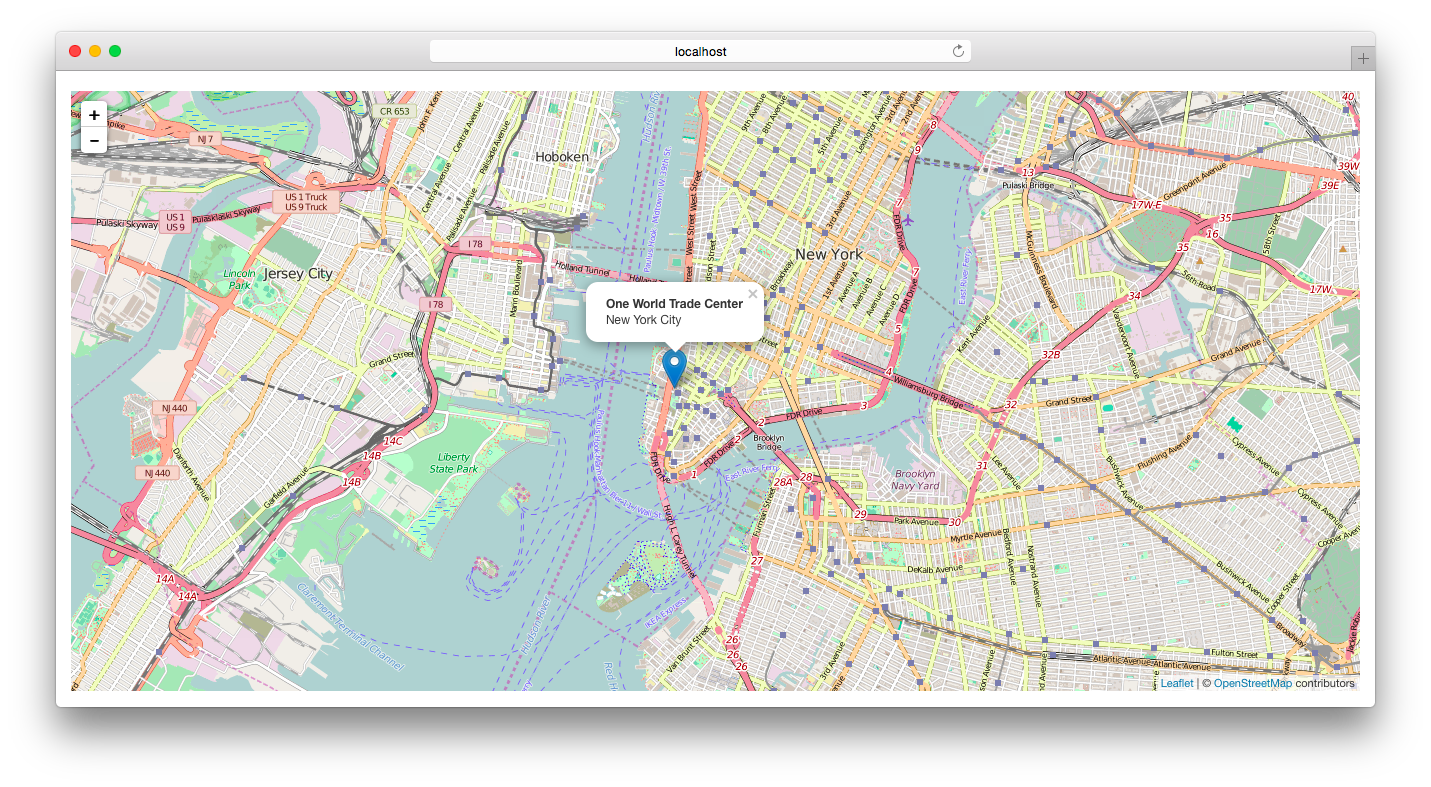
You can add a marker with the following line of code:
var marker = L.marker([40.713008, -74.013169]).addTo(map);
The array ([40.713008, -74.013169]) refers again to a latitude-longitude pair, in our example to the position of One World Trade Center.
You have many more options. For example, you can bind a popup to a marker:
var popupContent =  "<strong>One World Trade Center</strong><br/>";
	popupContent += "New York City";

// Create a marker and bind a popup with a particular HTML content
var marker = L.marker([40.713008, -74.013169])
	.bindPopup(popupContent)
	.addTo(map);
Result:
LayerGroups
Leaflet provides some features to organize markers and other objects that we would like to draw. Basically, it is a layering concept, which means that each marker, circle, polygon etc. is a single layer. These layers can be grouped into LayerGroups which makes the handling of these objects easier.
Suppose we want to create an interactive map for a hotel in New York City. We want to show the hotel location, the most popular sights, the nearest subway stations and so on. Now, we could create several LayerGroups for these elements. The advantage of this additional step is, that it is much easier to filter or highlight objects (e.g. show only sights).
// Add empty layer groups for the markers / map objects
nySights = L.layerGroup().addTo(map);
subwayStations = L.layerGroup().addTo(map);
// Create marker
var centralPark = L.marker([40.771133,-73.974187]).bindPopup("Central Park");

// Add marker to layer group
nySights.addLayer(centralPark);
Now you have a sights layer that combines these markers into one layer and that you can add or remove from the map in one single operation.
This was just a small example to help you get started with Leaflet. The library provides many more features and allows you to create powerful applications, especially if it is linked to D3 or other visualization components.
In the course of this lab we will show you a few more features but we encourage you to have a look at the Leaflet website for further implementation details and tutorials: http://leafletjs.com/
Activity II - Create an interactive map with Leaflet.js
-
Download Leaflet (latest stable version)
-
Integrate the library into your project
Unzip the downloaded archive to your website’s directory and reference the JS and CSS files in your HTML document.
<link rel="stylesheet" href="css/leaflet.css"><script src="js/leaflet.js"></script>Leaflet assumes that the directory
images(with leaflet images, e.g. markers) is in the same directory asleaflet.css.We would recommend you to separate the images from your css directory and stick to this structure:
- index.html is the default file that appears when a user invokes your webpage. It includes a basic structure and a placeholder for your interactive map.
- /js contains the JS libraries (Bootstrap, jQuery, leaflet) and your JS files
main.jsandstationMap.js - /data contains the data files
- /css contains the stylesheet files (libraries and custom styles)
- /img contains all the images
-
Instantiate a new Leaflet map object
You should implement all the map related functionality in stationMap.js.
General pipeline:
initVis()- Initialize static componentswrangleData()- Can be used later to filter/modify the dataupdateVis()- Draw the markers, objects etc. on top of the map
→ Create an instance of the Leaflet map, specify Boston as the geographical center and choose a proper zoom-level.
→ It would make sense to include the parameter for the map center in the object constructor function. As a result, the visualization would be more flexible, we could create several instances of
StationMapand define an individual location every time. Please adjust your code accordingly:For example, for a New York City map:
nyMap = new StationMap("ny-map", alldata, [40.712784, -74.005941]);Likewise, for our map of bike stations, we would use:
StationMap = function(_parentElement, _data, _mapPosition) { ... }→ Specify the path to the Leaflet images (in
initVis())// If the images are in the directory "/img": L.Icon.Default.imagePath = 'img/'; -
Load and display a tile layer on the map (in
initVis())OpenStreetMap:
http://{s}.tile.osm.org/{z}/{x}/{y}.pngDon’t forget to define a container height in css.
After reloading your webpage you should see the map. Currently, there are no markers visible but you should be able to zoom and pan.
-
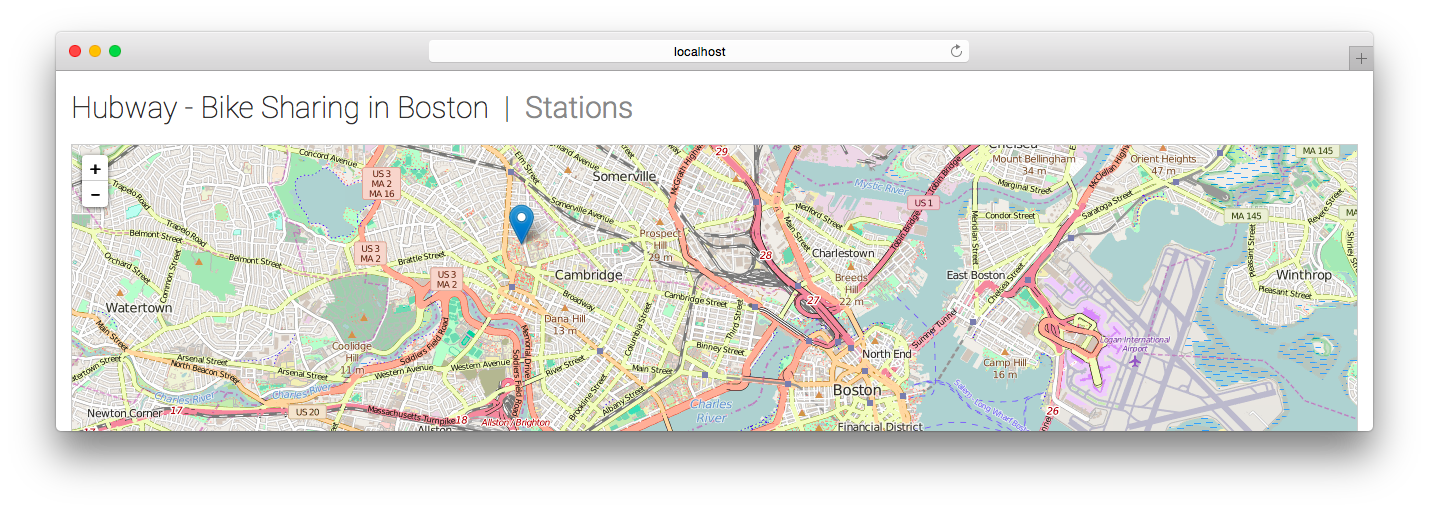
Draw a marker (in
updateVis())At the position of Maxwell Dworkin at Harvard University:
Latitude Longitude 42.378774 -71.117303 Preview:
-
Draw a marker for each station of the Hubway bike-sharing network (in
updateVis())If the creation of the single marker worked, reuse the code for this step. You don’t necessarily need the Mawell Dworkin marker anymore.
→ Loop through the dataset and append a marker for each station. Instead of fixed coordinates, use the individual latitude-longitude pairs of the stations to position the markers. Make sure, the map visualization stays as flexible as possible. For example, it should be easy to reuse the StationMap implementation for other bike-sharing networks.
It would also be a good opportunity to try the
LayerGroup. You can create a new, empty LayerGroup ininitVis(), then inupdateVis()you will need to clear the LayerGroup, and add all new elements to it.→ Bind a popup to each station marker that indicates the station name, available bikes and available docks.
Circles, lines and polygons
Besides markers, you can easily add other things to your map, including circles, lines and polygons.
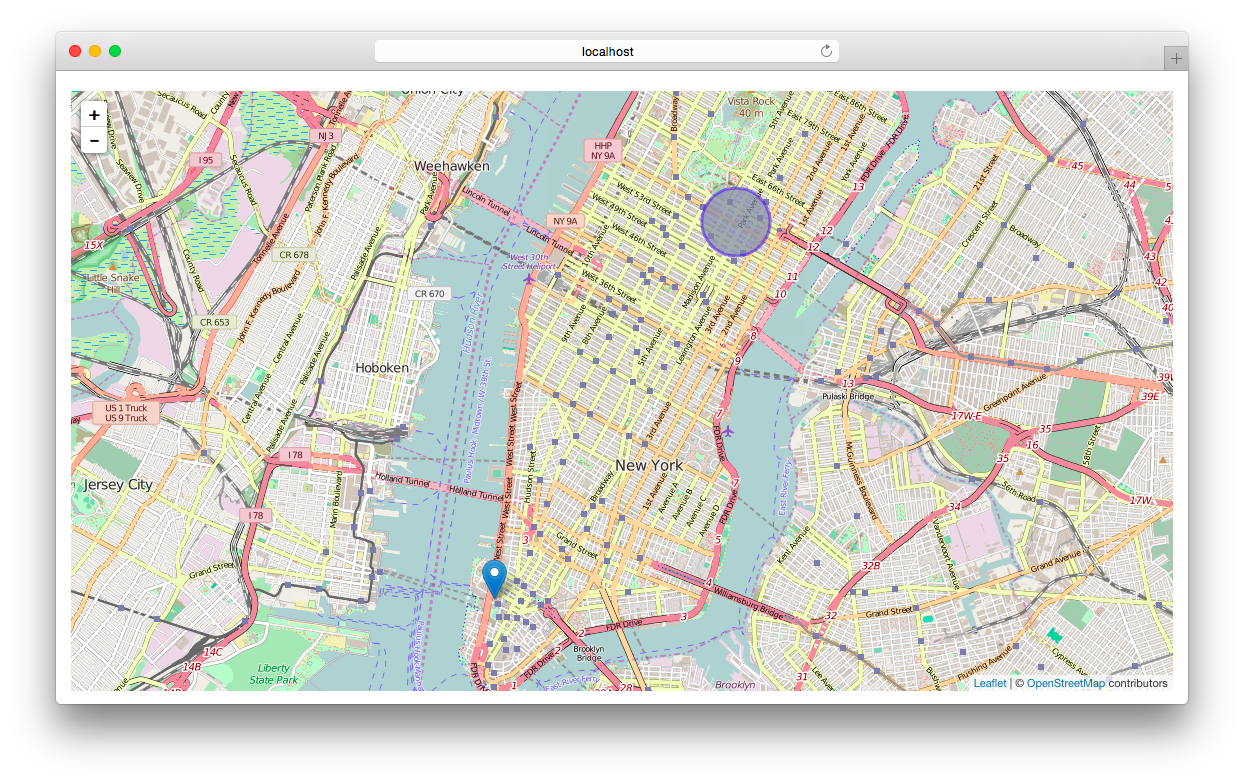
Adding a circle is similar to drawing markers but you need a radius (units in meters) and you can specify some additional visual attributes:
var circle = L.circle([40.762188, -73.971606], 500, {
    color: 'red',
    fillColor: '#ddd',
    fillOpacity: 0.5
}).addTo(map);
This piece of code creates a circle, centered at the Four Seasons New York with a radius of 500 meters.
Result:
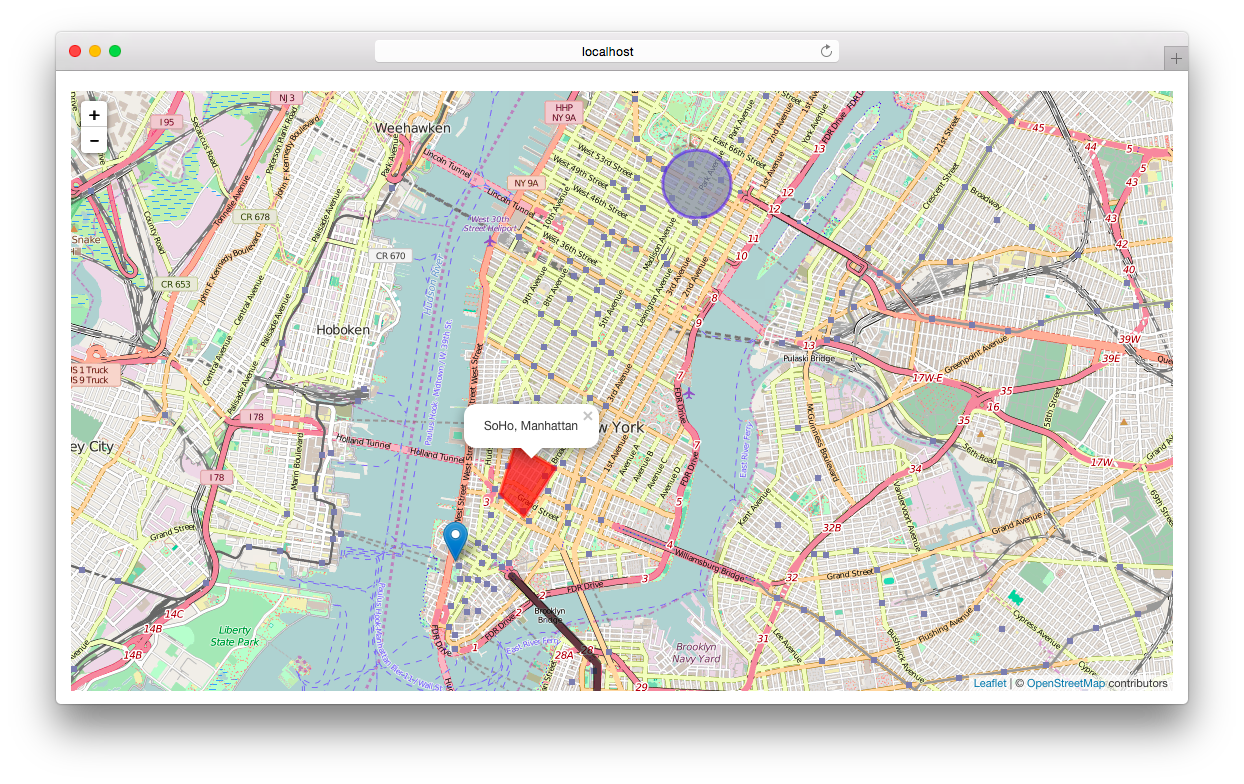
If you want to draw a line, you can use the Leaflet class Polyline. It follows the same concept. First you define the coordinates (in this case a list of latitude-longitude pairs) and then, optionally, you can define an object with visual attributes.
Draw a polyline between three points:
var polyline = L.polyline(
	[
		[40.711277, -74.003314],
		[40.699890, -73.988851],
		[40.696344, -73.988765]
	],
	{
		color: 'black',
		opacity: 0.6,
		weight: 8
	}
).addTo(map);
Adding a polygon is as easy. You just need to specify the corner points as a list of latitude-longitude pairs:
var polygon = L.polygon(
	[
	    [40.728328, -74.002868],
	    [40.721937, -74.005443],
	    [40.718961, -74.001280],
	    [40.725287, -73.995916]
	],
	{
		color: "red",
		fillOpacity: 0.5,
		weight: 3
	}
).addTo(map);
You can bind popups to these objects too:
polygon.bindPopup("SoHo, Manhattan");
GeoJSON Layer
Leaflet has also built-in methods to support GeoJSON objects. You are already familiar with this special JSON format.
GeoJSON support becomes very important if you want to draw complex shapes or many objects on a map.
After loading the GeoJSON objects (usually external files) you can add them to the map through a GeoJSON layer:
L.geoJson(geojsonFeature).addTo(map);
Leaflet automatically detects the features and maps them to circles, lines, polygons etc on the map.
In this example we have loaded a GeoJSON file with the five boroughs of New York City:
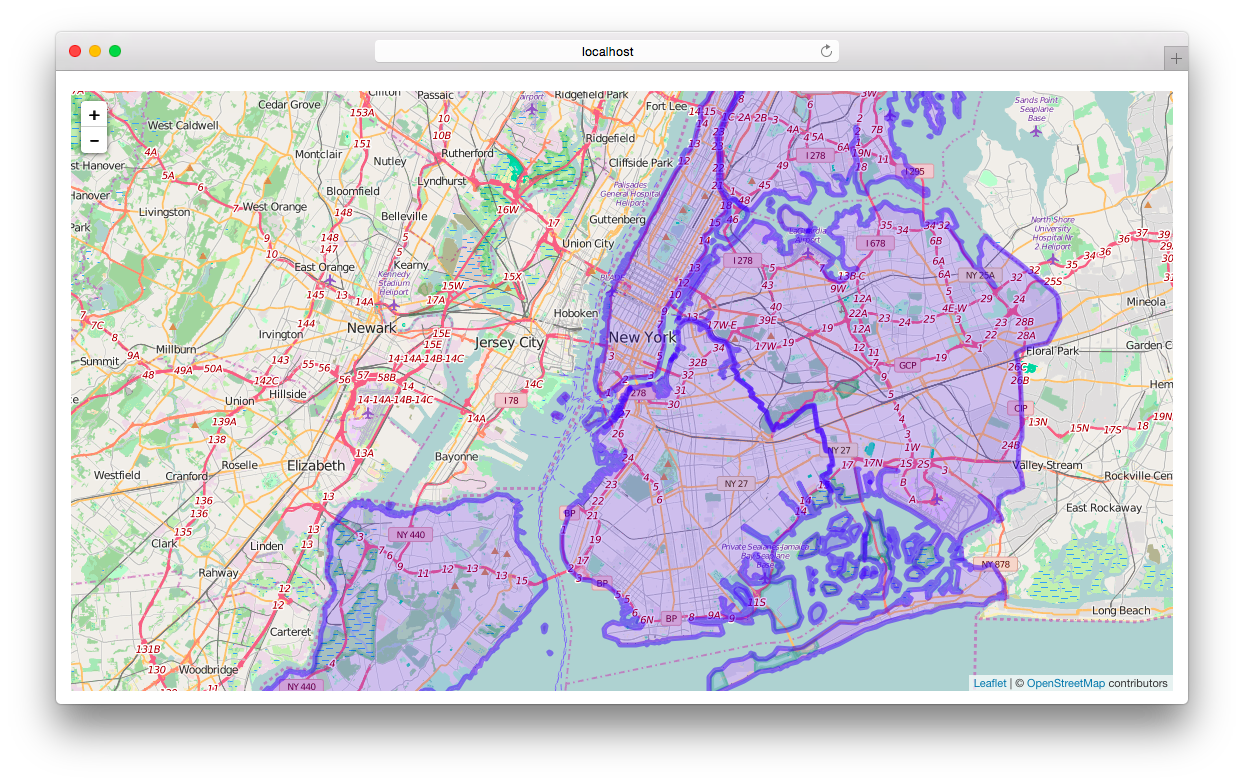
The library provides also a method to style individual features of the GeoJSON layer. You can assign a callback function to the option style which styles individual features based on their properties.
var boroughs = L.geoJson(data, {
	style: styleBorough,
	weight: 5,
	fillOpacity: 0.7
}).addTo(map);

function styleBorough(feature) {
	console.log(feature);
}
The output in the web console shows that the function styleBorough() is getting called for each borough (= GeoJSON feature):
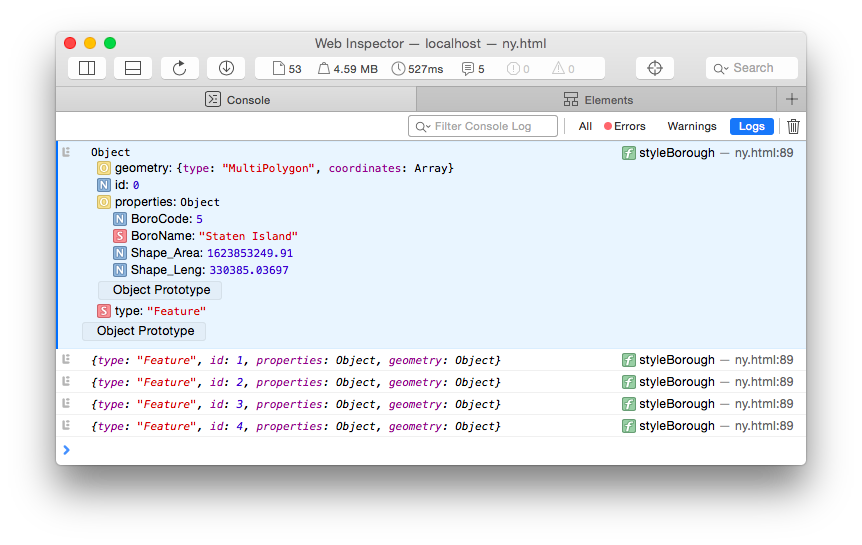
That means, we can access the properties of each borough (e.g. boroName) and style the shapes individually:
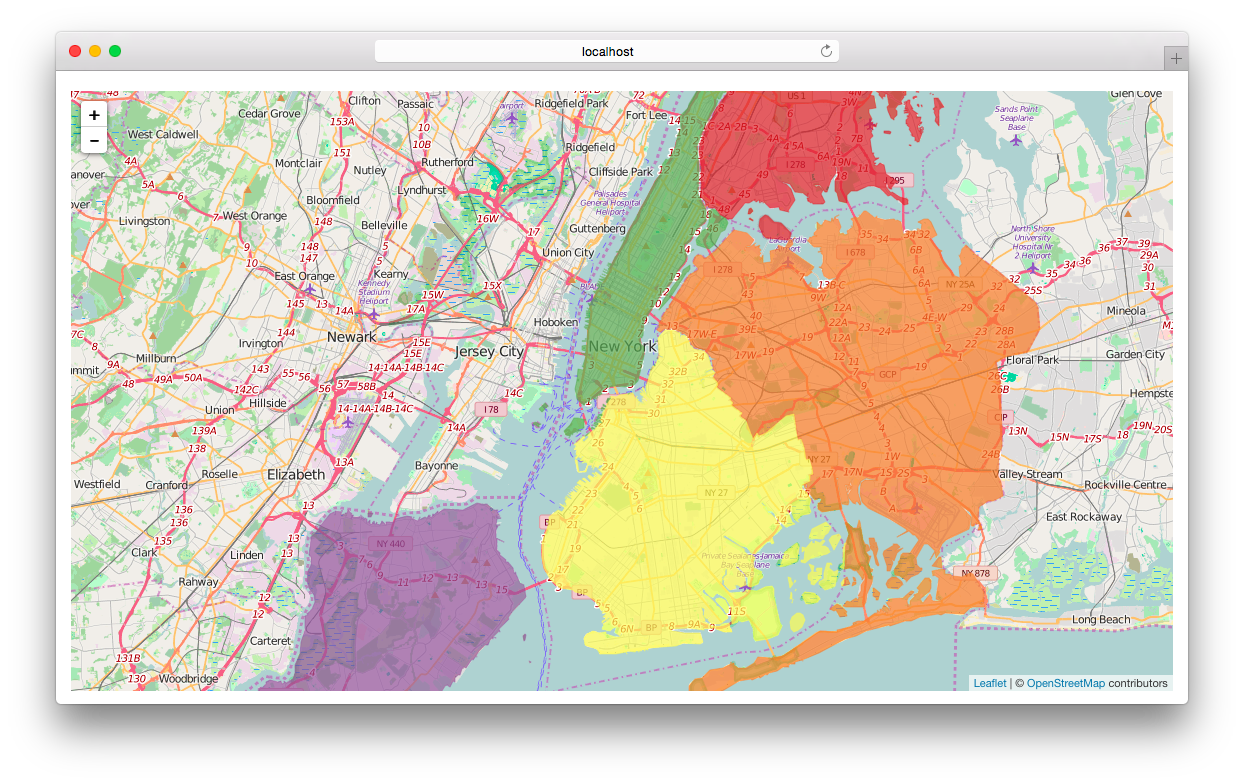
function styleBorough(feature) {
  switch (feature.properties.BoroName) {
      case 'Staten Island': 	return { color: "#895f9f" };
      case 'Manhattan': 		return { color: "#71a552" };
      case 'Queens': 			return { color: "#ea8441" };
      case 'Brooklyn': 			return { color: "#fff560" };
      case 'Bronx': 			return { color: "#cb3f3c" };
  }
}
JavaScript Switch
The switch expression is similar to an IF-ELSE statement. The value of the expression (e.g. borough name) is compared with the values of each case. If there is a match, the associated block of code is executed.
Example with IF-statement:
if(feature.properties.BoroName == 'Staten Island')
	return { color: "#895f9f" };
else if(feature.properties.BoroName == 'Manhattan')
	return { color: "#71a552" };
else if(feature.properties.BoroName == 'Queens')
	return { color: "#ea8441" };
else if(feature.properties.BoroName == 'Brooklyn')
	return { color: "#fff560" };
else
	return { color: "#cb3f3c" };
The switch block is compact and much easier to read.
After implementing the individual styles for the GeoJSON layer, the result looks like the following:
If you want to add popups to each feature of a GeoJSON layer, you have to loop through them too. Leaflet provides the option onEachFeature that gets called on each feature before adding it to a GeoJSON layer:
var boroughs = L.geoJson(data, {
	style: styleBorough,
	onEachFeature: onEachBorough
});

function onEachBorough(feature, layer) {
	layer.bindPopup(feature.properties.BoroName);
}
Activity III - Create a GeoJSON layer
-
Download GeoJSON data
MBTA Lines: http://cs171.org/2018/assets/scripts/lab10/MBTA-Lines.json
-
Load the data and render the GeoJSON objects on your map
Similar to the API request in Activity I, you can use jQuery to load a JSON file from your file system. You can load the JSON file either in the main.js and add it as a parameter to the constructor of StationMap, or you load the data directly in
initVis()of StationMap.$.getJSON(path, function(data) { // Work with data });→ Add the loaded GeoJSON objects to your map
You should see the MBTA subway lines on your map now.
-
Add styles to the GeoJSON layer
→ Access the properties of each feature (e.g.
LINE) and style the subway lines individually. Also play around with different parameters such as weight or opacity.Instead of a switch/if-statement you can use the name of the lines (red, green, …) directly for styling the features.
Bonus (optional) - Custom markers
In the following example we will show you how to assign custom icons to Leaflet markers.
The built-in styles of the marker class are rather sparse. There is only one marker style and you can’t choose the color dynamically. In the event that you need different markers, which might happen in the future, you can either create your own images or use a Leaflet extension (https://github.com/lvoogdt/Leaflet.awesome-markers).
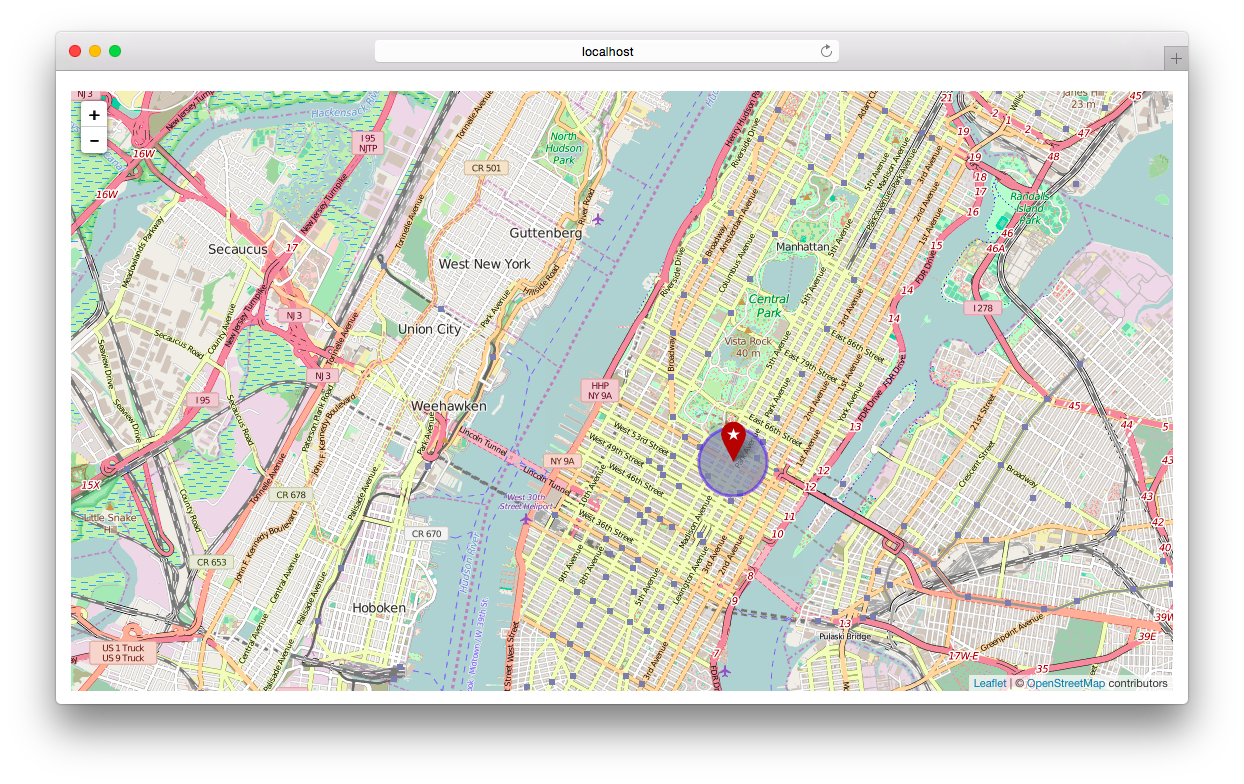
We continue with our NYC map and add a custom marker (with our own image) at the position of the Four Seasons Hotel.
A simple method for integrating custom icons is to modify the Leaflet images or to search for proper icons online. Make sure that the background of the images are transparent.
![]()
If we want to create several icons that have a lot in common, we can define our own icon class:
// Defining an icon class with general options
var LeafIcon = L.Icon.extend({
	options: {
		shadowUrl: 'img/marker-shadow.png',
		iconSize: [25, 41],
		iconAnchor: [12, 41],
		popupAnchor: [0, -28]
    }
});
Next, we can use this class to create individual icons:
var redMarker = new LeafIcon({ iconUrl:  'img/marker-icon-red.png' });
var blueMarker = new LeafIcon({ iconUrl:  'img/marker-icon-blue.png' });
And finally we can use these icons for our markers:
var marker = L.marker([40.762188, -73.971606], { icon: redMarker }).addTo(map);
Result:
Bonus Activity 1 (optional) - Custom markers
It would be very helpful to see more details about the stations without clicking on every marker to open the popup.
In this activity you will extend your visualization and show a rough overview of the network’s state. If a station of Boston’s bike-sharing network is in a critical condition (no bikes available or all docks occupied) you should highlight it.
-
Download icons
http://cs171.org/2018/assets/scripts/lab10/icons.zip
We are providing a set of different icons. You can choose two different marker styles to communicate the state of each station (critical, regular).
- marker-blue.png
- marker-green.png
- marker-red.png
- marker-yellow.png
-
Implement dynamic markers
→ Initialize the custom icons (in
initVis())→ Specify the icons for the markers depending on the current state of each station: (in
updateVis())- Critical: no bikes available or all docks occupied
- Regular: all other cases
This is just a basic solution to demonstrate how to integrate some dynamic logic into Leaflet maps. It would definetely make sense to distinguish between “no bikes available” and “all docks occupied” and to set different thresholds.
Bonus Activity 2 (optional) - Tile Layers
The tiles provided from OpenStreetMap are very dense and packed with a lot of information. This is not always ideal. For users who want to get a quick overview, it can be hard to grasp the essential information we want to communicate.
As already mentioned earlier in this lab, Leaflet is provider-agnostic and enables us to load tiles (map imagery) from various sources. Depending on the particular application it makes sense to select different tiles.
This Leaflet webpage shows a great overview of available tiles and gives you examples of how to include them in your project: https://leaflet-extras.github.io/leaflet-providers/preview/
→ Replace your current OpenStreetMap tiles with data from another provider. For example, the map imagery from Stamen can be easily integrated, without any registration or API key.
If you are more interested in creating maps and working with different map imagery, we would highly recommend you to try MapBox. The provider offers many different default styles and a powerful tool to create your own map designs. Unfortunately, there is a usage-limitation for map views at no charge, but with 50,000 view/months it is rather high.
Congratulations, you have now completed the activities of Lab 10!
Submission of lab (activity I, II, and III)
Please submit the code of your completed lab (the final map visualization you created in activities I-IV). In Canvas, under this week’s modules, use the Lab 10 Submission link. Upload a zipped folder with your implementation.
Resources
- Official jQuery Webpage: https://jquery.com/
- Leaflet Quick-Start: http://leafletjs.com/examples/quick-start.html
- Leaflet Tile-Providers: https://leaflet-extras.github.io/leaflet-providers/preview/
- Dealing with cross-domain issues: