
CS171 - Homework 4
This homework requires that you have read and programmed along with chapters 7 and 8 in D3 - Interactive Data Visualization for the Web.
1) Complete and Submit Lab 4 (4 points)
Due to Indigenous Peoples’ Day/ Columbus Day (Monday, 10/08/2018) this week’s lab will not take place on campus but is set as part of this homework. Please complete Lab 4 as the first part of the homework and submit it as usual under Canvas - Lab 4 Submission. You will get your usual points for the lab submission, plus up to 4 points in this homework for completing the lab! Please don’t forget to read the lab’s pre-reading and fill out the lab’s quiz, which will be online: October 8 (Monday) at 2:50pm till October 14 (Sunday) at 11:59pm for ALL CS171 students (on-campus and extension school).
Follow this link to Lab 4 - Instructions
2) Za’atari Refugee Camp (6 points)
Za’atari is a refugee camp in Jordan that opened in 2011 to host people fleeing from the Syrian civil war. With around 80,000 refugees it is one of the largest UN-supported camps and over the past few years it transformed from a tent camp to a real city with water and sewage systems, markets, coffee shops etc.
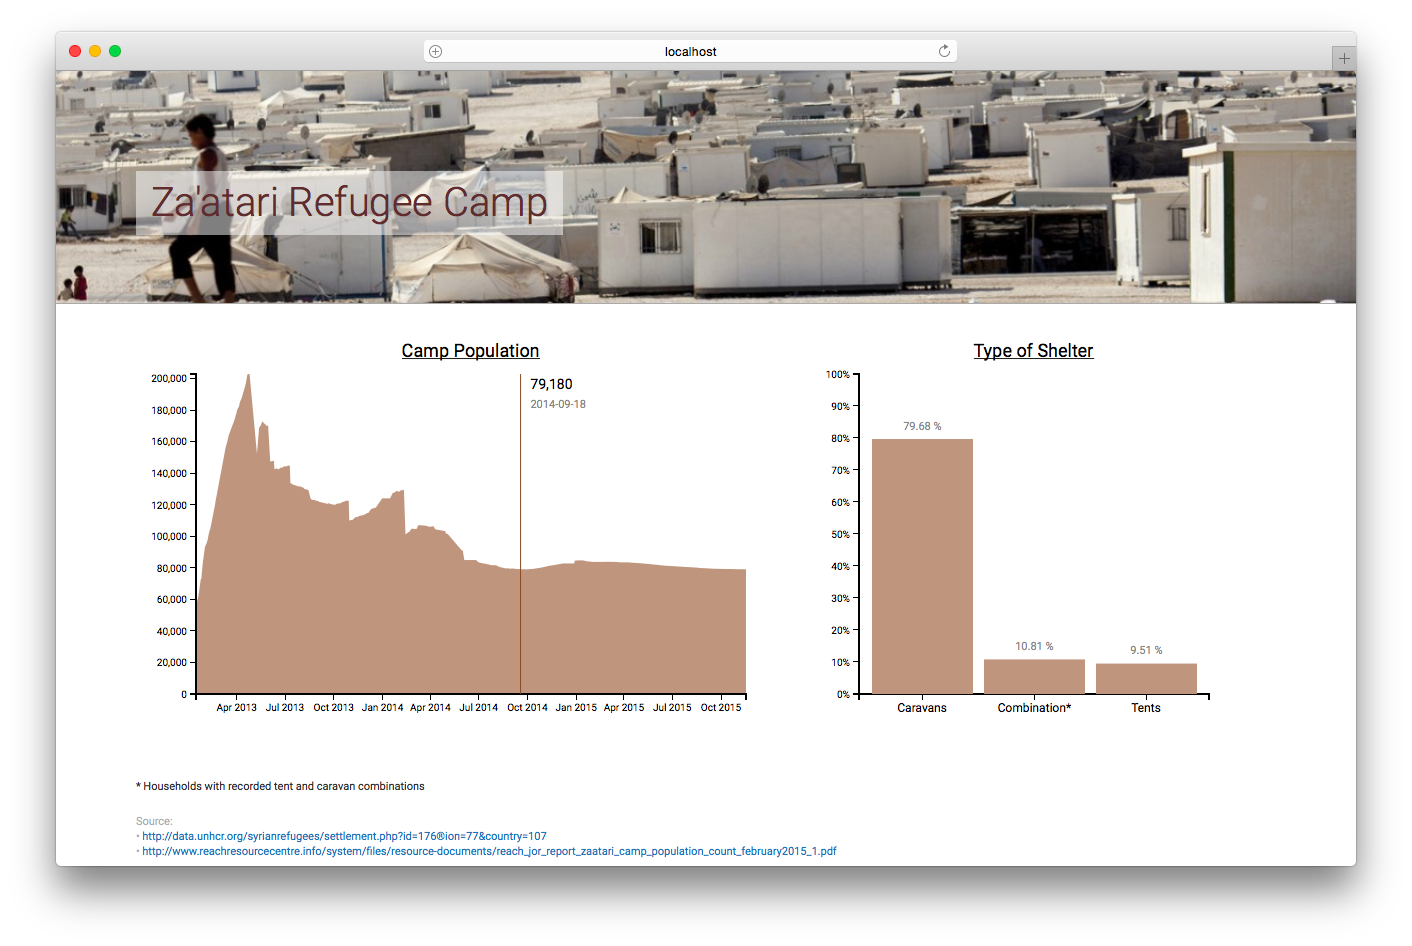
In this homework you will create two charts to present data from Za’atari in a meaningful way.
Data
Population
As part of this homework assignment we provide a CSV file with population statistics between January 2013 and November 2015. The statistics are based on active registrations in the UNHCR database.
http://www.cs171.org/2018/assets/scripts/hw4/zaatari-refugee-camp-population.csv
Type of Shelter
The REACH initiative and Unicef evaluated the type of shelters in the Za’atari refugee camp. Although, the camp is gradually transforming into a real city, a lot of people still have to live in tents:
The vast majority of households (79.68%) were recorded as living in caravans. That number was followed by 10.81% of households recorded as living in a combination of tents and caravans, while 9.51% were observed to be living in tents only.
Implementation
-
Download the data
Please download the CSV data: http://www.cs171.org/2018/assets/scripts/hw4/zaatari-refugee-camp-population.csv
-
Set up a new D3 project and create a two-column layout in your HTML file During the course of this homework you will add an area chart to the left column and a bar chart to the right column.

-
Load the CSV file and prepare the data for the area chart
The dates are loaded as string values. Similar to numeric values (e.g.
d.price = +d.price) you have to convert these values. You will need Date Objects to create flexible time scales later.This website should help you to convert the data into the right format: https://github.com/d3/d3-time-format/blob/master/README.md. Make sure to test your results before continuing.
-
From now on, your charts should implement the D3 margin convention
Create
margin,height, andwidthvariables and append a new SVG drawing space for the area chart to the HTML document via JavaScript. -
Area chart: Before you create the actual area chart, create linear scales for the x- and y-axes
Use the D3 time scale function for the x-axis. It is an extension of d3.scaleLinear() that uses JS date objects as the domain representation.
Read more about D3’s time scales: https://github.com/d3/d3-scale/blob/master/README.md#time-scales. You can (and should) always google for additional examples, if you are still unclear on the usage of D3 elements we require you to include.
-
Area chart: Map the population data to the area (using SVG path)
Compared to a simple line chart you should fill the whole area between the data points and the x-axis.
To create an area chart, follow the steps below:
a. Define a function that generates the area:
See https://github.com/d3/d3-shape/blob/master/README.md#areas (
d3.area()) for details.b. Draw the area (using an SVG path element)
 var path = svg.append("path")
   .datum(data)
   .attr("class", "area")
   .attr("d", area);
c. Change the style with CSS
If any of these steps are unclear, study some D3 area chart examples online. Make sure you understand the code before you implement it yourself!
d. Bonus (optional): Render the actual boundary (upper line of the area chart) as line, with different visual properties.
-
Area chart: Append the x- and y-axes and add a chart title
From now on, we expect that you will always label your charts, display meaningful axes, and provide a legend if necessary. Also, make sure your axes start at appropriate values. In data visualization we aim to create meaningful, easy-to-understand visualizations to provide insight into the data. Missing labels or axes are often a main cause for misunderstanding data!
- Format the labeling of the x-axis to display the month and year in text format (e.g. April 2013).
- Make sure that the labels don’t overlap each other, by rotating the text labels of the x-axis.
-
Create a compound JS data structure to store information about the shelter types
Store the information you have about the different shelter types in your own data structure. (As a reminder, 79.68% of households were recorded as living in caravans. 10.81% of households live in a combination of tents and caravans, while 9.51% live in tents only.)
- Store the type of shelter and percentage values.
- You will have to use your data structure for your bar chart afterwards, so make sure that it is as simple and efficient as possible. The actual implementation is up to you.
-
Create a vertical bar chart for the camp’s three shelter types
- Append a new SVG drawing area for the bar chart (using D3 margin conventions) to the right column of your webpage.
- Map the data from your new dataset to SVG rectangles to create a vertical bar chart (refer to the screenshot in Section Implementation.1 for how it should look). The y-axis represents the percentage of people living in one of the three shelter types.
- Usa a linear scale for the y axis.
- For the x dimension you may choose to use either an ordinal scale or no explicit D3 scale function, as there are only 3 categories. (Note, however, that in one of the next steps you will have to add labels for each bar. Your scale implementation here affect the way you add labels later.)
- Add a chart title.
-
Bar chart: Draw x- and y-axes
The ticks of the y-axis should be formatted as percentages.
-
Bar chart: Append labels at the top of each bar to indicate the actual percentages
- Each bar should have a label to indicate the percentage, directly above the bar.
- Each bar should also have a label with the name of the shelter type. This can be done either by using a categorical x axis, or by manually adding text labels.
-
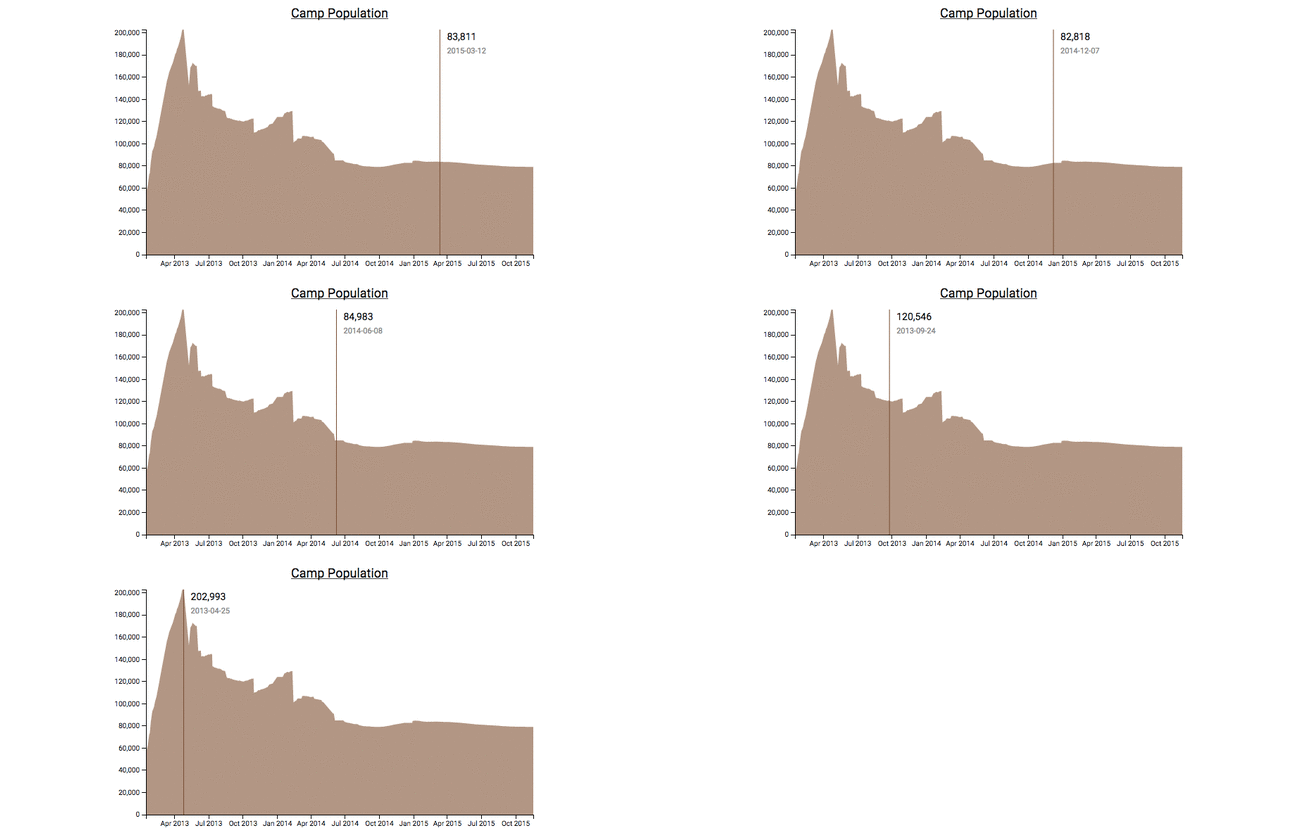
Create dynamic tooltips for your area chart

There are many different ways to include tooltips. This tutorial shows one way and can be used as a guide - but feel free to experiment! Also note that this tutorial still uses an older version of D3 - so you would have to adapt it to work with version 4.
http://www.d3noob.org/2014/07/my-favourite-tooltip-method-for-line.html
Make sure the tooltip shows the camp’s population for the current mouse position, as shown in the above animation.
Note: This step is relatively complex, compared to the earlier steps. Make sure you understand and play around with the example code first! Then, add individual elements step-by-step and make sure they are working before adding on more elements.
-
Use CSS to style the webpage
Spacing between charts, font size, color scheme, …
This is your space to be creative! Please use at least 3 CSS styles, and keep the design guidelines you have learned so far in lecture in mind. But you don’t need to go overboard. (Required are 3 different CSS styles)
Congratulations on finishing the D3 part of your homework! Up until now, all your visualizations have been static (i.e., the initial visualization did not change after first rendering). Over the next couple of weeks you will learn how to dynamically update visualizations, and how to create dynamic transitions. You will also learn how to link two or more visualizations together, so that the interaction in one view will automatically trigger an update of the second view!
3) Bonus Task (1 point)
Please make sure to finish all previous tasks completely before you start with the bonus activity. Extra credit is only given if the rest of the homework has been completed and the full possible points have been received. This task is intended for those of you who have already more experience with JS libraries.
At this point your webpage should contain a static bar chart with shelter types and an area chart showing the total camp population from 2013 to 2015. You have also implemented dynamic tooltips for the area chart to show individual values when the mouse pointer is moved over the chart.
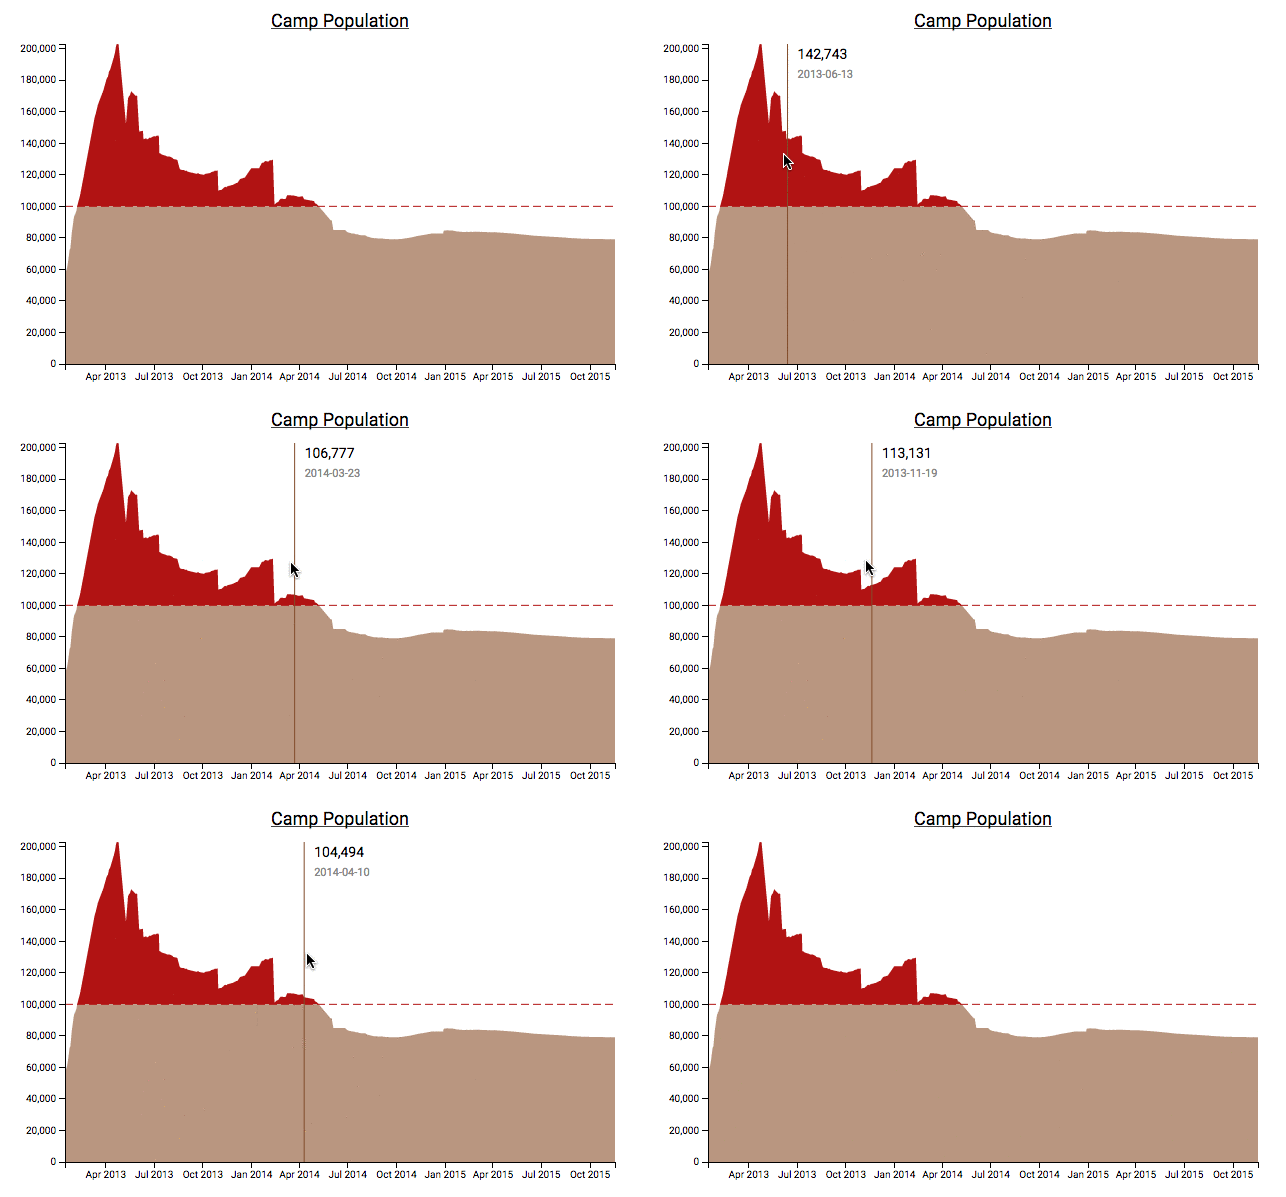
In this bonus activity you should further extend your area chart and color two specified regions differently. Assume that the Za’atari refugee camp had a planned capacity of 100,000 people. This threshold was exceeded quickly. Show it in your visualization by coloring the critical region (> 100,000) and by adding a line at this point:

You can either draw two paths (d3 area function) and clip the defined regions or you can use one path with a gradient fill.
Of course the mouse pointer and the dynamic tooltips should remain unchanged.
4) Submit Homework in Canvas
Submission instructions:
- Use the following recommended folder structure:
/submission_FirstnameLastname
	hw/
	    implementation/ ...folder for your code
   	        index.html
	        css/ 		...folder with all CSS files
	        js/ 		...folder with all JavaScript files
-
Make sure to keep the overall size of your submission under 5MB!
-
Upload a single .zip file.
-
Also submit the completed lab (activity I, II, and III) on Canvas.
Congratulations for finishing Homework 4! See you in class!