

COMPSCI 1710 Visualization - Fall 2025
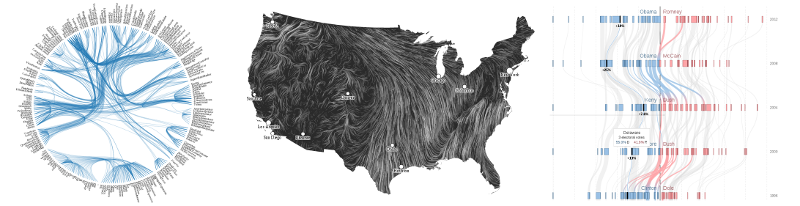
The amount and complexity of information produced in science, engineering, business, and everyday human activity is increasing at staggering rates. The goal of this course is to expose you to visual representation methods and techniques that increase the understanding of complex data. Good visualizations not only present a visual interpretation of data, but do so by improving comprehension, communication, and decision making.
In this course you will learn how the human visual system processes and perceives images, good design practices for visualization, methods for visualization of data from a variety of fields, and programming of interactive web-based visualizations using D3.
This website is for the Harvard College COMPSCI 1710 and SCI 6472 courses, formerly known as CS 171. All our weekly materials, assignments, handouts, and readings will be listed on Canvas under Modules.
Enrollment: There are no enrollment limits for Harvard College students.
Instructors and Head TF
Hanspeter Pfister (Instructor)
Johannes Knittel (Head TF)
Course Sessions
Lab: Mondays, 2:15 PM - 3:30 PM ET
Lecture: Wednesdays, 2:15 PM - 3:30 PM ET
Room: 2111+2112, 114 Western Ave
Teaching Fellows/Assistants
- Robert Roessler
- Grace Guo
- Chunggi Lee
- Richard Morello
- Anitej Thamma
- Siva S Thangaraj
Previous Years
2015 Website 2015 Video Archive