
Lab 3
Pre-Reading Quiz
Please fill out the pre-reading quiz on Canvas at the beginning of class!
Learning Objectives
- Know how to use basic shape elements in SVG
- Advanced JS: method chaining; anonymous functions; first intuition about asynchronous execution & callbacks
- Know how to include D3 in your project
- Know the structure and syntax of a basic D3 visualization
- Know how to load data into D3
- Know how to bind data to visual elements
Prerequisites
- You have read chapter 3 (p. 52-62) and chapter 5 (p. 67-72, p. 79-87) in D3 - Interactive Data Visualization for the Web.
In the previous weeks you have learned a lot about the fundamentals of web development. Now, you should be well prepared for the upcoming phase where you will work on interactive data visualizations with D3.
D3 - First Steps
D3.js (Document-Driven-Data) is a powerful JavaScript library for manipulating documents based on data.
“D3 allows you to bind arbitrary data to a Document Object Model (DOM), and then apply data-driven transformations to the document. For example, you can use D3 to generate an HTML table from an array of numbers. Or, use the same data to create an interactive SVG bar chart with smooth transitions and interaction.” (d3.js, Mike Bostock)
A summary of D3’s features and key aspects by Scott Murray:
- Loading data into the browser`s memory
- Binding data to elements within the document and creating new elements as needed
- Transforming those elements by interpreting each element’s bound datum and setting its visual properties accordingly
- Transitioning elements between states in response to user input
We will introduce all these concepts in the following weeks.
D3 Version
CS171 is using D3 version 4!
Even though D3 version 5 was released a couple of months ago, we will use version 4 in this class. The main reason for this is that the D3 book uses version 4, and we want to be consistent with the book. The differences between version 4 and version 5 are mostly minor, you can look at them in more detail here. When looking up code online, be aware that many examples still use version 3, which was a lot less modular than version 4.
D3 Integration
This is a brief overview of how to set up a basic D3 project. This should not be completely new but it might help you to solve the activity later.
Before working with D3 you have to download and include the D3 JavaScript library first. For course submissions, we recommend the minified version (d3.min.js) which has a smaller file size and faster loading time. However, during development (and thus in the templates we provide), you might prefer to use the readable original version (d3.js).
- D3 Webpage: https://d3js.org/
- D3 Download: https://github.com/d3/d3/releases/download/v4.13.0/d3.zip
Your file and folder structure for D3 projects should look like the following:
project/
	index.html
	css/
		style.css
	js/
		d3.min.js
		main.js
Below, we have to update our HTML boilerplate code to include a reference to D3, to another JS file (main.js) and to an external CSS file (style.css). You should keep your own JS code separated from the JS libraries you are using. In the future you might have more than one library and don’t want to change your code every time you update one of them (e.g. new release), so make sure you encapsulate your own code into separate files (libraries). Make also sure to include libraries before using them in your code (order of script tags).
<!DOCTYPE html>
<html lang="en">
<head>
    <meta charset="UTF-8">
    <title>D3 Project</title>
    <link rel="stylesheet" href="css/style.css">
</head>
<body>

	<script src="js/d3.min.js"></script>
	<script src="js/main.js"></script>
</body>
</html>
An Overview of SVG (Scalable Vector Graphics)
- SVG is defined using markup code similar to HTML
- SVG elements don’t lose any quality if they are resized
- SVG elements can be included directly within any HTML document or dynamically inserted into the DOM with JavaScript
- Before you can draw SVG elements you have to add an
<svg>-element with a specific width and height to your HTML document, for example:<svg width="500" height="500"></svg> - The SVG coordinate system places the origin (0/0) in the top-left corner of the svg element.
- SVG has no layering concept or depth property. The order in which elements are coded determines their depth order.
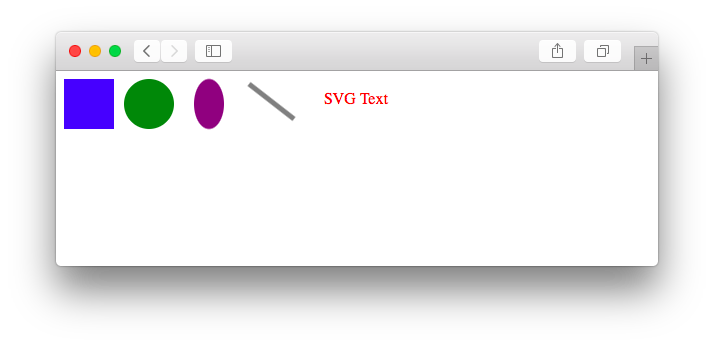
Basic shape elements in SVG: rect, circle, ellipse, line, text and path
Examples:
<svg width="400" height="50">

<!-- Rectangle (x and y specify the coordinates of the upper-left corner -->
<rect x="0" y="0" width="50" height="50" fill="blue" />

<!-- Circle: cx and cy specify the coordinates of the center and r the radius -->
<circle cx="85" cy="25" r="25" fill="green" />

<!-- Ellipse: rx and ry specify separate radius values -->
<ellipse cx="145" cy="25" rx="15" ry="25" fill="purple" />

<!-- Line: x1,y1 and x2,y2 specify the coordinates of the ends of the line -->
<line x1="185" y1="5" x2="230" y2="40" stroke="gray" stroke-width="5" />

<!-- Text: x specifies the position of the left edge and y specifies the vertical position of the baseline -->
<text x="260" y="25" fill="red">SVG Text</text>

</svg>
Result:
Adding a DOM Element with D3
In the previous labs and homeworks you have already worked with dynamic content and added new elements to the DOM tree, most likely with plain JavaScript or jQuery.
Now, we want to generate new page elements with D3. After loading the D3 library we can add our own script (e.g., main.js).
Our JS script (main.js) consists actually only of one line of code:
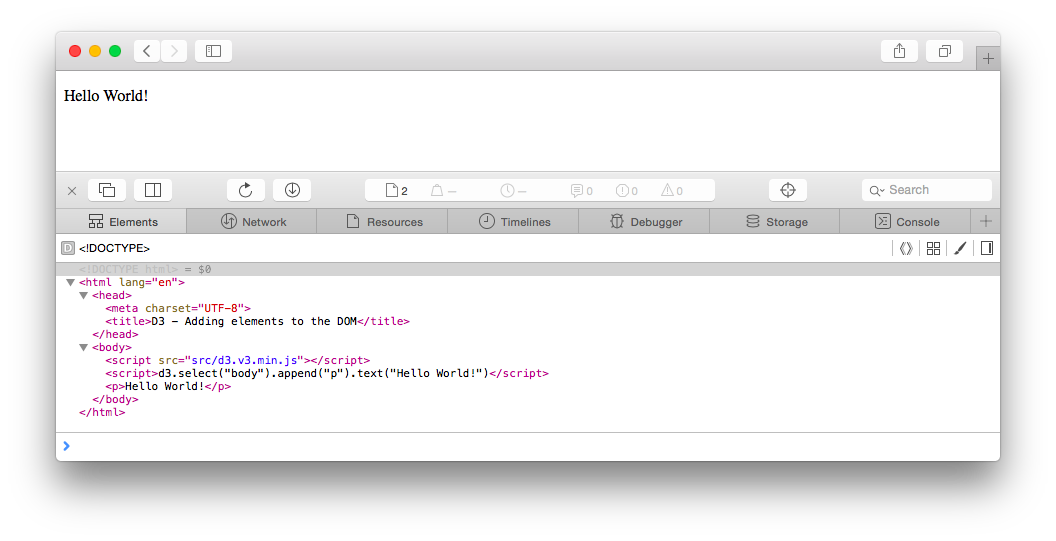
d3.select("body").append("p").text("Hello World!");
In this example we have used D3 to add a paragraph with the text “Hello World!” to a basic webpage.
Before going into further details we want to introduce the JS concept of Method Chaining briefly:
Method Chaining
Method or function chaining is a common technique in JS, especially when working with D3. It can be used to simplify code in scenarios that involve calling multiple methods on the same object consecutively.
- The functions are “chained” together with periods.
- The output type of one method has to match the input type expected by the next method in the chain.
Alternative code without method chaining:
var body = d3.select("body");
var p = body.append("p");
p.text("Hello World!");
(We will use the chain syntax in most examples and templates)
d3 - References the D3 object, so we can access its functions by starting our statement with: d3.
D3 Select
The D3 select() method uses CSS selectors as an input to grab page elements. It will return a reference to the first element in the DOM that matches the selector.
In our example we have used d3.select("body") to select the first DOM element that matches our CSS selector: body. Once an element is selected - and handed off to the next method in the chain - you can apply operators. These D3 operators allow you to get and set properties, styles and content (and will again return the current selection).
(Alternatively, if you want to select more than one element, use selectAll(). We will try it later in an example.)
D3 Append
After selecting a specific element we have used an operator to assign content: .append("p")
The append() operator adds a new element as the last child of the current selection. We specified “p” as the input argument, so an empty paragraph has been added to the end of the body. The new paragraph is automatically selected for further operations.
At the end we have used the text() property to insert a string between the opening and closing tags of the current selection.
In summary, all methods together:
d3.select("body")
	.append("p")
	.text("Hello World!");
Your D3 statements can be much longer, so we recommend putting each method on its own indented line.
Activity I
-
Download D3 version 4: https://github.com/d3/d3/releases/download/v4.13.0/d3.zip
-
Create a new D3 project
You can use the updated boilerplate from above. At this point it might also be a good idea to create a template project (i.e., directory structure) that you can copy every time you create a new project. The template project should include the directory structure for your project and all the files and boilerplate you usually need (e.g., D3 libraries, Bootstrap and JQuery libraries, etc.). You can also use our provided template project and download it here.
-
Add an SVG rectangle to the HTML document
Width: 400px, Height: 200px; Color: Green
-
Use D3 to add a
div-container with the text “Dynamic Content” to the DOM
Binding Data to DOM Elements
“Data visualization is a process of mapping data to visuals. (Scott Murray)
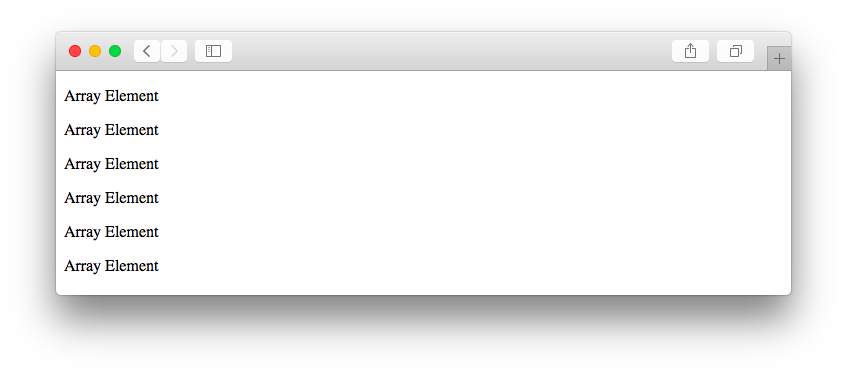
Similar to our last example we are using basic HTML paragraphs, but this time we append a new paragraph for each value in a given array:
var states = ["Connecticut", "Main", "Massachusetts", "New Hampshire", "Rhode Island", "Vermont"];

var p = d3.select("body").selectAll("p")
	.data(states)
	.enter()
	.append("p")
	.text("Array Element");
(1) .select("body") - Reference to the target container
(2) .selectAll("p") - Selection representing the elements (paragraphs) we want to create
(3) .data(states) - Loads the dataset (array of strings). The data could be also numbers, objects or other arrays. Each item of the array is assigned to each element of the current selection.
Instead of returning just the regular selection, the data() operator returns three virtual selections:
- Enter contains a new placeholder for any missing elements
- Update contains existing elements bound to the data
- Exit contains existing elements that are not bound to data anymore and should be removed
There are no “p”-elements on the page so the enter selection contains placeholders for all elements in the array. In this and the following examples we will concentrate only on the enter selection. You will learn more about the enter-update-exit sequence when we are working with interactive datasets.
(4) .enter() - Creates new data-bound elements/placeholders
(5) .append("p") - Takes the empty placeholder selection and appends a paragraph to the DOM for each element.
(6) .text("Array Element") - Adds a string to each newly created paragraph
Dynamic Properties
The dataset has been loaded and bound to new paragraphs but all the appended elements contain the same content: “Array Element”.
If you want access to the corresponding values from the dataset you have to use anonymous functions:
.text( function (d) { return d; } );
In this example we have included a JS function in the text() operator.
Anonymous Functions
A simple JS function looks like the following:
function doSomething (d) {
	return d;
}
It has a function name, an input and an output variable. If the function name is missing, then it is called an anonymous function. If you want to use the function only in one place, an anonymous function is more concise than declaring a function and then doing something with it as two separate steps. We will use them very often in D3 to access individual values and to create interactive properties.
.text( function (d) { return d; } );
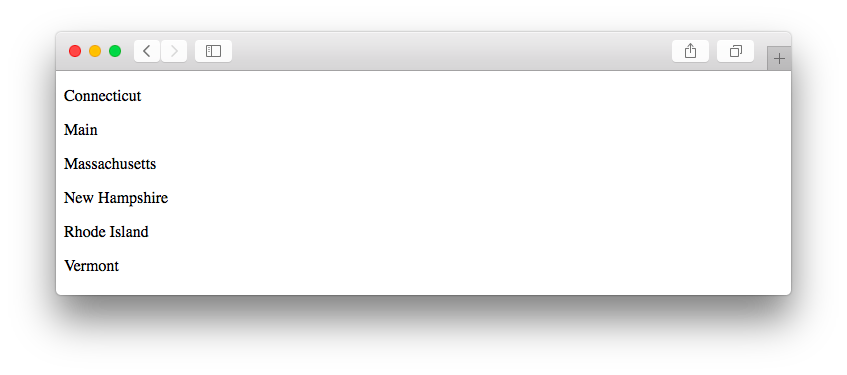
In our case we are using the function to access individual values of the loaded array. That is one feature of D3: It can pass array/data elements and corresponding data indices to an anonymous function (which is called for each array element individually).
Generally in D3 documentation and tutorials, you’ll see the parameter d used for the current data element and i (or index) used for the index of the current data element. The index is passed in as the second element to the function calls and is optional.
Example for an anonymous function that passes the data element and index:
.text( function (d, index) {
	return console.log("element: " + d + " at position: " + index);
} );
It is still a regular function, so it doesn’t have to be a simple return statement. We can use if-statements, for-loops and we can also access the index of the current element in our selection.
HTML attributes and CSS properties
As already mentioned earlier, we can get and set different properties and styles - not only the textual content. This becomes very important when working with SVG elements.
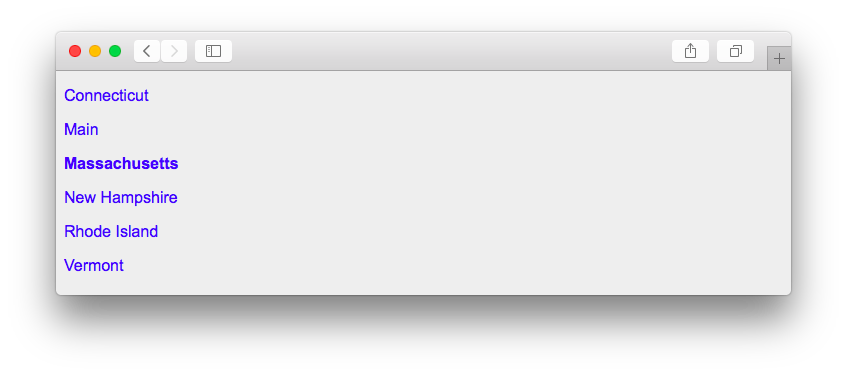
Example (1) - Add paragraphs and set properties
var states = ["Connecticut", "Main", "Massachusetts", "New Hampshire", "Rhode Island", "Vermont"];

// Change the CSS property background (lightgray)
d3.select("body")
	.style("background-color", "#EEE");

// Append paragraphs and highlight one element
d3.select("body").selectAll("p")
	.data(states)
	.enter()
	.append("p")
	.text(function(d){ return d; })
	.attr("class", "custom-paragraph")
	.style("color", "blue")
	.style("font-weight", function(d) {
		if(d == "Massachusetts")
			return "bold";
		else
			return "normal";
	});
- We use D3 to set the paragraph content, the HTML class, the font-color and as the last property, the font-weight which depends on the individual array value
- If you want to assign specific styles to the whole selection (e.g. font-color: blue), we recommend you to define an HTML class (“custom-paragraph” in our example) and add these rules in an external stylesheet. That will make your code concise and reusable.
Result:
Example (2) - Add SVG rectangles and set properties
var numericData = [1, 2, 4, 8, 16];

// Add svg element (drawing space)
var svg = d3.select("body").append("svg")
	.attr("width", 300)
	.attr("height", 50);

// Add rectangle
svg.selectAll("rect")
	.data(numericData)
	.enter()
	.append("rect")
	.attr("fill", "red")
	.attr("width", 50)
	.attr("height", 50)
	.attr("y", 0)
	.attr("x", function(d, index) {
		return (index * 60);
	});
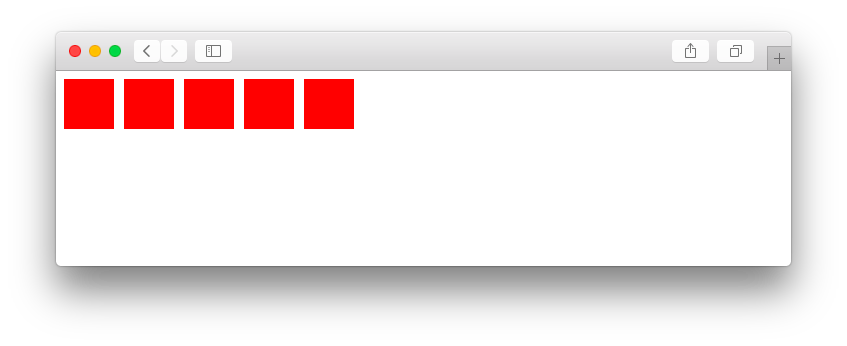
- We have appended SVG elements to the DOM tree in our second example. This means that we had to create the SVG drawing area first. We did this with D3 and saved the selection in the variable
svg(in case you wonder why thed3object is missing in the second statement). - It is crucial to set the SVG coordinates. If we don’t set the x and y values, all the rectangles will be drawn on the same position at (0, 0). By using the index - of the current element in the selection - we can create a dynamic x property and shift every newly created rectangle 60px to the right.
Result:
Activity II
Use your files from the first activity. You don’t have to create a new project.
-
Append a new SVG element to your HTML document with D3 (Width: 500px, Height: 500px)
-
Draw circles with D3
Append a new SVG circle for every object in the following array:
var sandwiches = [ { name: "Thesis", price: 7.95, size: "large" }, { name: "Dissertation", price: 8.95, size: "large" }, { name: "Highlander", price: 6.50, size: "small" }, { name: "Just Tuna", price: 6.50, size: "small" }, { name: "So-La", price: 7.95, size: "large" }, { name: "Special", price: 12.50, size: "small" } ]; -
Define dynamic properties
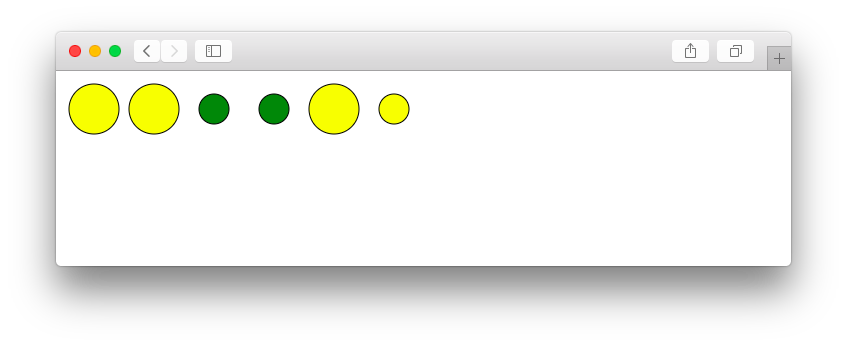
- Set the x/y coordinates and make sure that the circles don’t overlap each other
- Radius: large sandwiches should be twice as big as small ones
- Colors: use two different circle colors. One color (
fill) for cheap products < 7.00 USD and one for more expensive products - Add a border to every circle (SVG property:
stroke)
The result might look like the following:
Loading external data
Instead of typing the data in a local variable, which is also only convenient for small datasets, we can load data asynchronously from external files. The D3 built-in methods make it easy to load JSON, CSV and other files.
You should already be familiar with the JSON format from the previous lab and you have probably worked with CSV files in the past too.
CSV (Comma Separated Values)
Similar to JSON, CSV is a file format which is often used to exchange data. Each line in a CSV file represents a table row and as the name indicates, the values/columns are separated by a comma.
In a nutshell: The use of the right file format depends on the data - JSON should be used for hierarchical data and CSV is usually a proper way to store tabular data.
We’ll store the same sandwich price information in a CSV file. Most of the time CSV files are generated by exporting data from other applications, but for this example you should manually copy the data shown below into a blank file and save it as .CSV:
sandwiches.csv (create this file in a subfolder of your project named “data”)
name,price,size
Thesis,7.95,large
Dissertation,8.95,large
Highlander,6.50,small
Just Tuna,6.50,small
So-La,7.95,large
Special,12.50,small
By calling D3 methods like d3.csv(), d3.json(), d3.tsv() etc. we can load external data resources in the browser:
d3.csv("data/sandwiches.csv", function(data) {
	console.log(data);
});
These functions (asynchronous requests) take two arguments: a string representing the path of the file, and an anonymous function, to be used as a callback function.
Callback Functions and Asynchronous Execution
Why do we need an asynchronous execution? → The page should be visible while data is loading and scripts that do not depend on the data should run immediately, while scripts that do depend on the data should only run once the data has been loaded!
A callback function is a function that is passed to another function. It can be anonymous or named. We have used them multiple times before, for example to set the content:
.text(function(d){ return; d };The text() method executes the anonymous callback function we have passed to it. That means, we don’t call the anonymous function directly and it is also not getting executed immediately. It is invoked after some kind of event and usually it is “called back” once its parent function is complete.
In our data loading problem, we have to ask if we can read the file from the disk or an external server, but that usually takes a while. Hence, we are using an asynchronous execution: We don’t have to wait and stall, instead we can proceed with further tasks that do not rely on the dataset. After receiving a notification that the data loading process is complete, the callback function is executed.
Code that depends on the dataset should generally exist only in the callback function! (You can still structure your code in separate functions, however, if these functions depend on the dataset, they should only be called inside the callback function).
Updated main.js
d3.csv("sandwiches.csv", function(data) {
	console.log("Data loading complete. Work with dataset.");
	console.log(data);
});

console.log("Do something else, without the data");
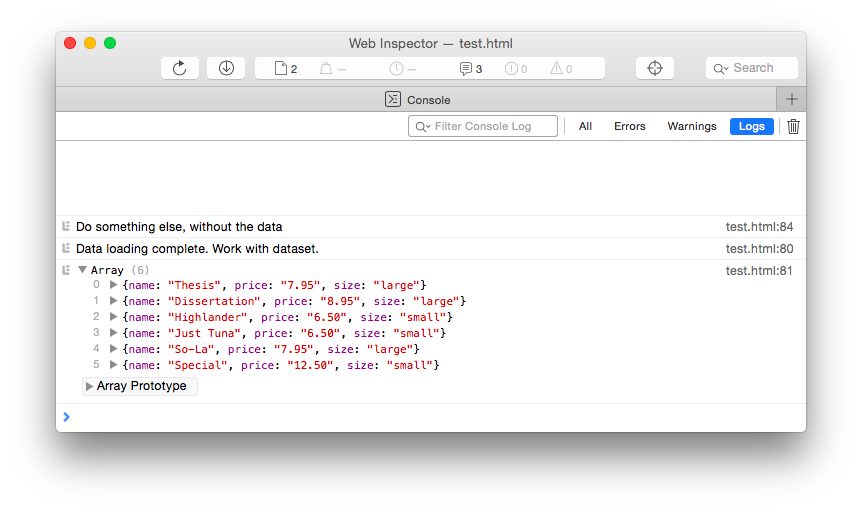
The result below shows that the execution order is different than what you might have expected:
The callback function - the inner function of d3.csv() - is called only after the dataset is loaded completely to browser memory. In the meantime other scripts are executed.
Activity III
Use your files from the previous activity. You don’t have to create a new project.
-
Download the dataset: http://www.cs171.org/2018/assets/scripts/lab3/cities.csv
-
Use D3 to load the CSV file
Write the data to the web console and inspect it in your browser:
- In which format is the information stored now?
- Which properties are available?
- Check the types of the variables (with JavaScript code)
-
Filter the dataset
We are only interested in cities that are part of the European Union (EU). In the remainder of the activity use the filtered dataset.
-
Append a new paragraph to your HTML document
Count all elements in the filtered dataset and use D3 methods to write the result (i.e., the number of EU countries) to your webpage.
-
Prepare the data
You might have noticed that each value of the CSV file is stored as a string, including numerical values.
- Convert all numerical values to numbers. (Otherwise you might see unexpected behavior when making calculations.)
-
We recommend iterating over all rows and using a statement similar to the following code snippet. Putting a “+” in front of a variable converts that variable to a number (you can also use
parseInt()orparseFloat()):d.age = +d.age;
-
Draw one SVG circle for each row in the filtered dataset
- All the elements (drawing area + circles) should be added dynamically with D3
- SVG container: width = 700px, height = 550px
- Use the x/y coordinates from the dataset to position the circles
-
Dynamic circle properties
Change your default radius to a data-dependent value:
- The radius should be 4px for all cities with a population lower than 1.000.000.
- The radius for all the other cities should be 8px.
-
Assign labels with the names of the European cities
- Use the SVG text element
- All the elements should have the same class:
city-label - The labels should be only visible for cities with a population equal or higher than 1.000.000. You can use the SVG property
opacityto solve this task.
-
Styling
Create a new external stylesheet if you have not done it yet.
Add proper styles to your webpage but include at least these CSS rules for the class
city-label:- Font size = 11px
- Text anchor = middle
Your result should look similar to this screenshot:
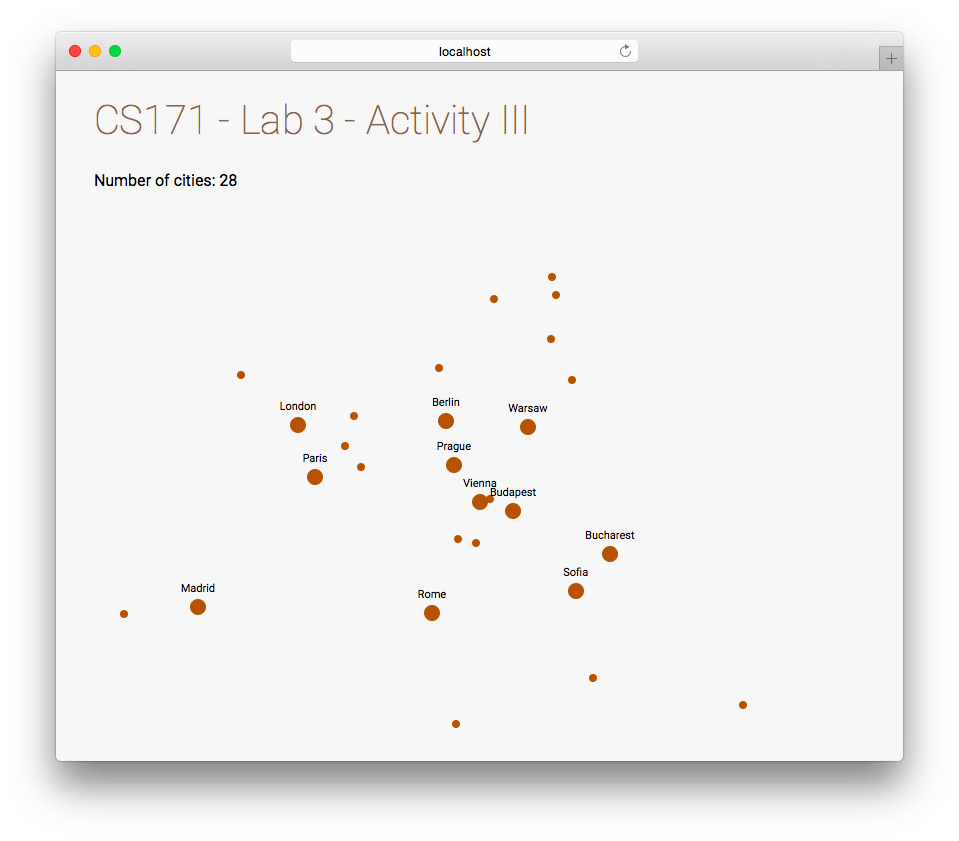
Important notice: This example is not intended to be a best practice example of how to work with D3 scales. It was designed to help you to get a better understanding of different basic concepts in D3.
Next week you will learn how to create real scales for different types of data, you will work with more flexible size measurements and you will learn how to use D3 axes in your visualizations.
Later in this course you will also learn how to create interactive maps.
Bonus Activities
-
Add tooltips (https://bl.ocks.org/d3noob/257c360b3650b9f0a52dd8257d7a2d73) displaying the country for each city.
-
Change the hover style of the SVG circles.
-
Add a D3 click listener and write the population of the clicked city (i.e., circle) to the web console.
Submission of lab (only Activity III) as part of homework 3
Congratulations, you have now completed the activities of Lab 3!
Please upload the code of your completed lab (only Activity III) with your homework 3 submission! Make sure to upload all files of this lab in a subfolder called “lab”.
Resources
- Chapter 3-6 in D3 - Interactive Data Visualization for the Web by Scott Murray
- https://www.dashingd3js.com/
- http://dataviscourse.net/2015/lectures/lecture-d3/