Homework 2
In this assignment, you’ll use HTML, CSS and JavaScript to create a small dashboard for a local pizza delivery company. It should help the company to get meaningful insights into their collected data and to evaluate their performance. We provide a small framework, based on Bootstrap, and two example datasets.
In the design part of this homework you have to critique a visualization (you can choose between two given examples) and you have to create a few sketches, similar to our previous lecture.
This homework assumes that you have read and programmed along with chapter 3 (up to page 53) in D3 - Interactive Data Visualization for the Web (Second Edition) by Scott Murray.

1. Complete lab 2
Please complete lab 2 and submit it. It is due with the rest of this homework, you can find the upload link on Canvas, in this weeks module.
2. PizzaWorld - Insights & Statistics (6 points)
Framework
We are providing a small template (based on Bootstrap) for this homework. It is quite similar to the framework which we have used in our second lab and should help you to get started. You can download the framework for homework 2 here.
You will need to extend the following files:
index.htmlcss/style.cssjs/main.js
Data
We have included two datasets from PizzaWorld in the framework. One table has 1198 rows with pizza deliveries and the other table has 200 rows with corresponding customer feedback.
The data (arrays with JSON objects) are already stored in these two global variables:
deliveryDatafeedbackData
The variables are accesible in the JS file main.js
To get started, write the variables to the web console and inspect them.
Delivery Data
delivery_iddate-
area(BostonCambridge Somerville) price(in USD)count(number of delivered pizzas)driverdelivery_time(minutes)temperature-
drinks_ordered(truefalse) -
order_type(webphone)
Feedback Data
delivery_id(matches the deliveries)-
punctuality(mediumlow high) -
quality(mediumlow high) -
wrong_pizza(truefalse)
Implementation
-
Download framework
If you haven’t done so already, please download the framework for homework 2.
-
Display dataset summary
Extract the following numbers from the provided data and append them with meaningful labels to the HTML document (part 2 in function
createVisualization()):- Number of pizza deliveries
- Number of all delivered pizzas (count)
- Average delivery time
- Total sales in USD
- Number of all feedback entries
- Number of feedback entries per quality category: low, medium, high
→ You should do all of that (extracting numbers and adding labels to HTML) directly in JavaScript. Update the DOM dynamically with JavaScript!
Feel free to use plain JavaScript methods (see lab 2) or the library jQuery to update the content. The JS framework jQuery is already included because it is required for Bootstrap. You can learn more about jQuery on these websites: jquery.com or w3schools.com/jquery/.
Make sure you test your code after you have implemented this part! Once your code is working, consider your code structure and code design:
a) If your code is already longer than a couple of lines, extract it into a separate function and call that function within createVisualization().
b) Think about calculating the above numbers at the same time (e.g., inside a single loop), if possible. That will make the code shorter and easier to read, as well as faster.
c) Make sure you use consistent spacing, layout, self-explanatory variable names, and code comments! If you do this as you progress in your coding project, this will save you a lot of time later!
-
Call the function: renderBarChart(deliveryData)
If you call renderBarChart() our script will automatically group (and count) the deliveries per day. Subsequently a bar chart will be added to the container:
#chart-area.Requirements:
- You need a div-container with the id
#chart-areain your HTML document - As a function parameter, you have to include a JSON array with deliveries (each delivery is an object and must include at least the property:
date). Try to call renderBarChart() (insidecreateVisualization) with the variabledeliveryData.
→ You should now see a basic bar chart in your webpage.
- You need a div-container with the id
-
Filter the data before drawing the bar chart
In the next task, you should filter the
deliveryDataarray depending on the selected options, before calling renderBarChart().a. Add two select-boxes to your HTML document. The user should be able to select:
area(All, Boston, Cambridge or Somerville)order type(All, Web or Phone).
Make sure to set the callback function of the select boxes to the function that updates and creates our visualization!
b. If the user selects an option, filter the variable
deliveryDataaccordingly and then call renderBarChart() again. Every time you call this function, it will analyze all changes in your array and update the chart with D3.It is good practice to do a sanity check on the result you get after filtering or processing data. Take a look at the original data, do the numbers make sense? Are there missing values? This is especially important when dealing with real-world data that has not been cleaned and prepared for easy use in a homework ;-)
-
Global data filtering
In the previous step you have implemented a function which reacts to the user input (change of a select-box value) and updates the chart immediately.
Additionally, these filter options should also affect the displayed dataset summary that you implemented earlier.
→ If the user filters the data by a specific
areaororder typeyou should update the bar chart and the display of the summary data from step (2).Hint: The data are stored in two separate variables. Make sure your filtering algorithm influences customer feedback as well as order data.
-
Style your webpage using CSS.
We already provided a simple css file in our template. Adjust either the CSS or the html elements you dynamically generate to create a visually pleasing and easy to read webpage.
3. Design Analysis / Critique (2 points)
- Choose ONE of the visualizations (A or B)
- Evaluate the visualization based on lie factor, data-ink ratio and graphical integrity
-
Answer the following questions:
- Who is the audience?
- What questions does this visualization answer?
- What design principles best describe why it is good / bad?
- Why do you like / dislike this visualization?
- How could the data-ink ratio be improved? And can you suggest any other improvements?
Please do not use more than 400 words (cumulative) to evaluate the visualization and answer all questions. You will have to submit your design critique as a PDF document (critique.pdf).
Take a look at this guide on how to write a design critique. We expect you to use all the knowledge we have covered in lectures already, but not more.
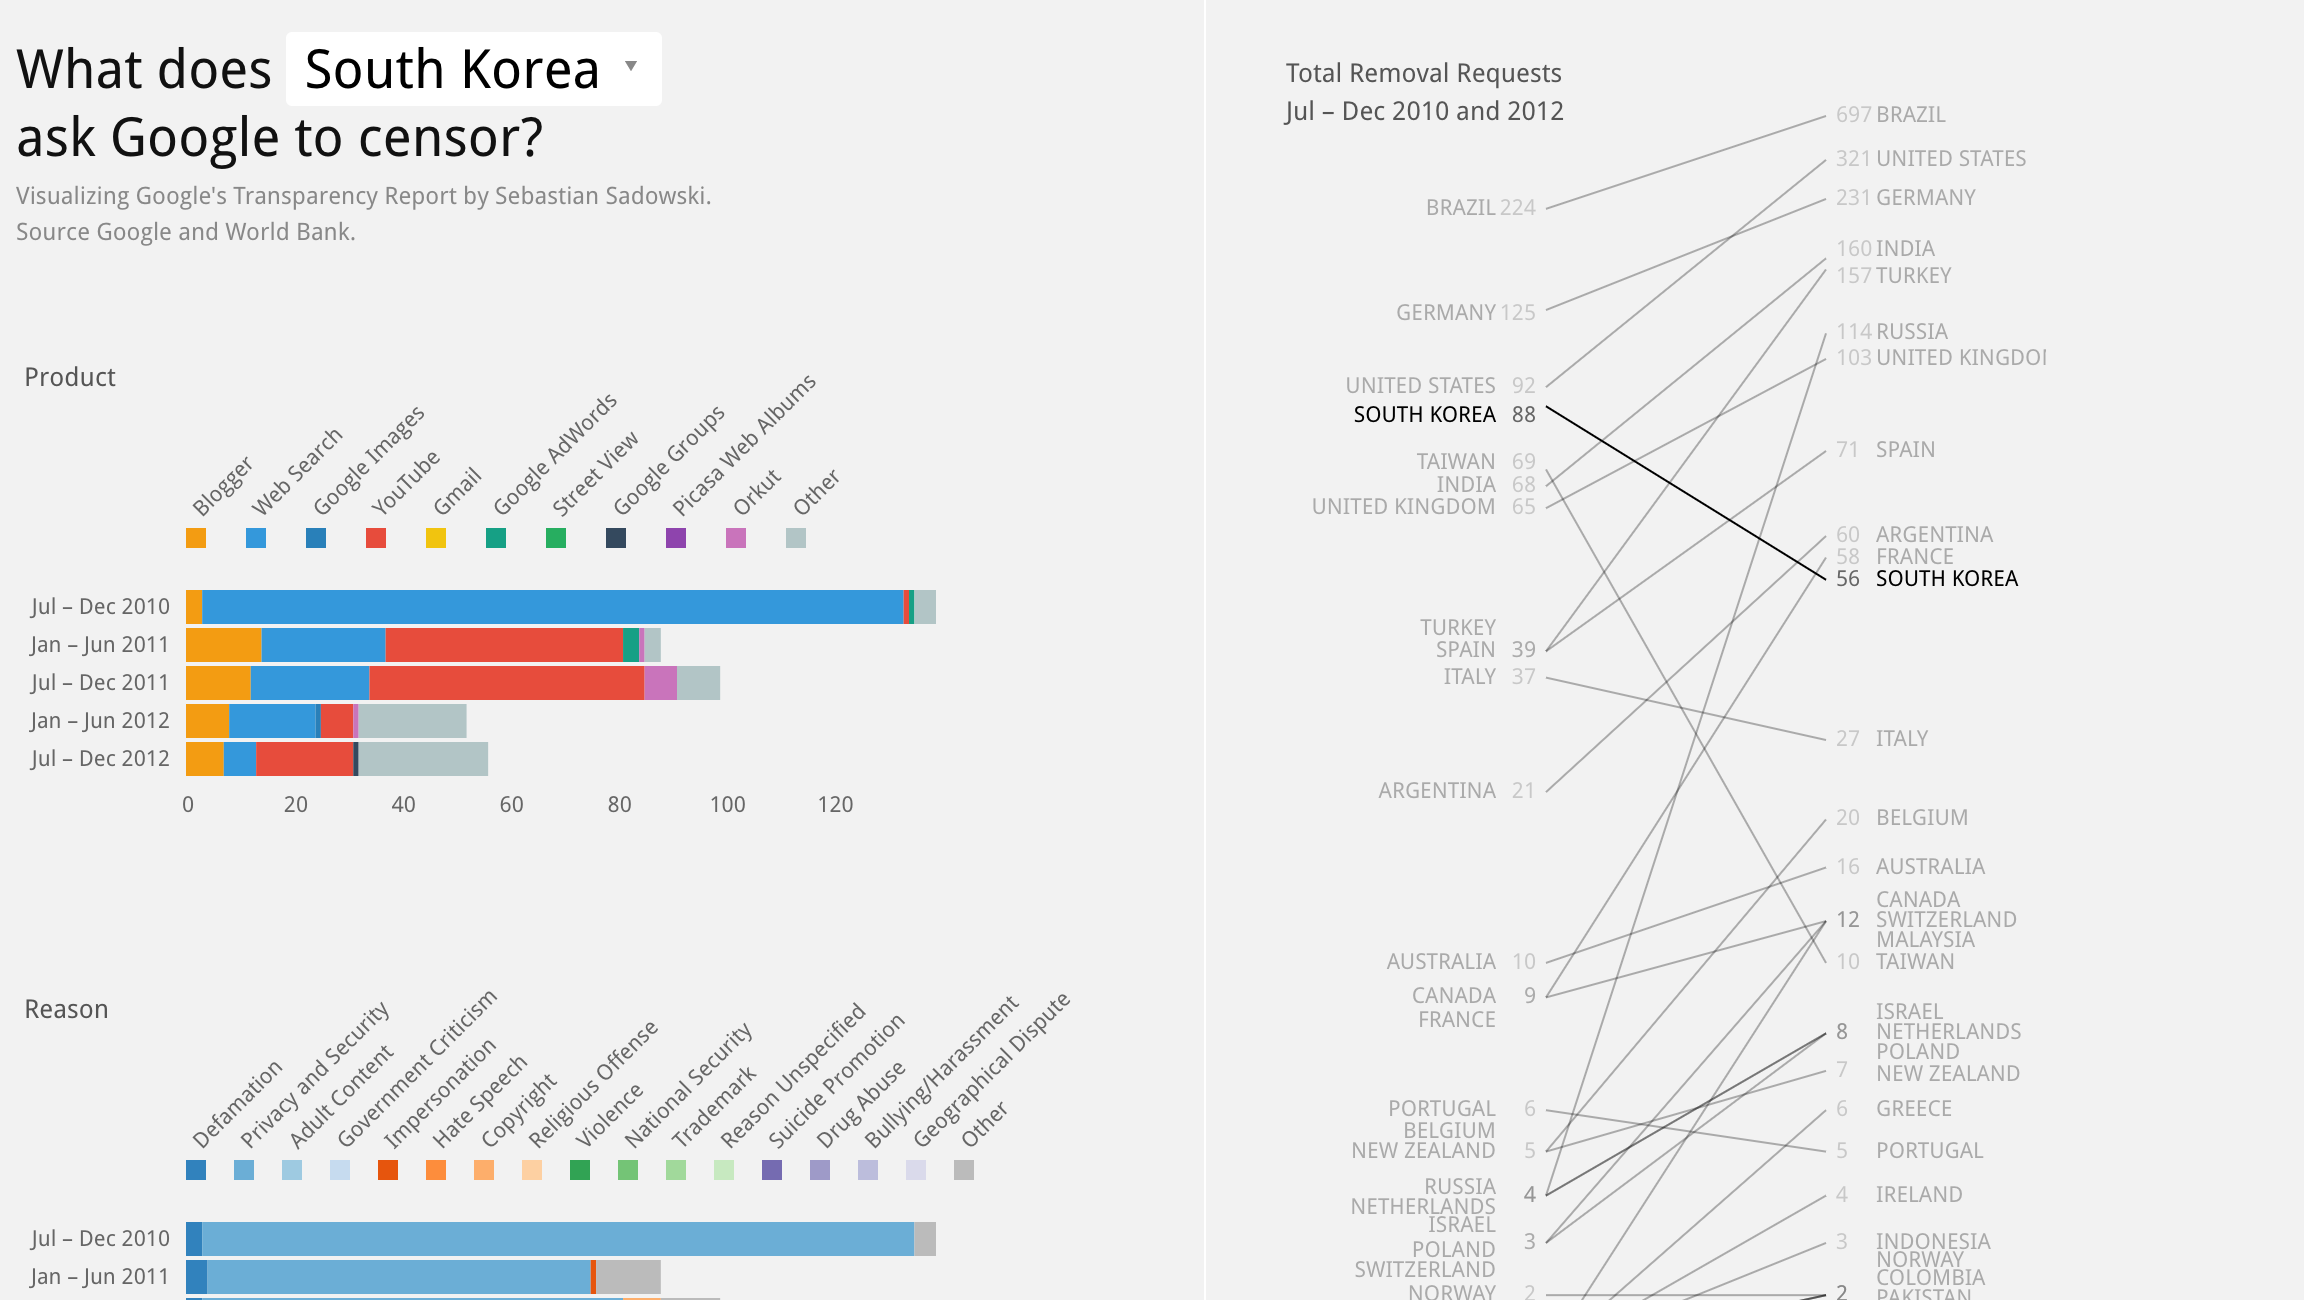
Visualization A
http://transparencyreport.ahoi.in/

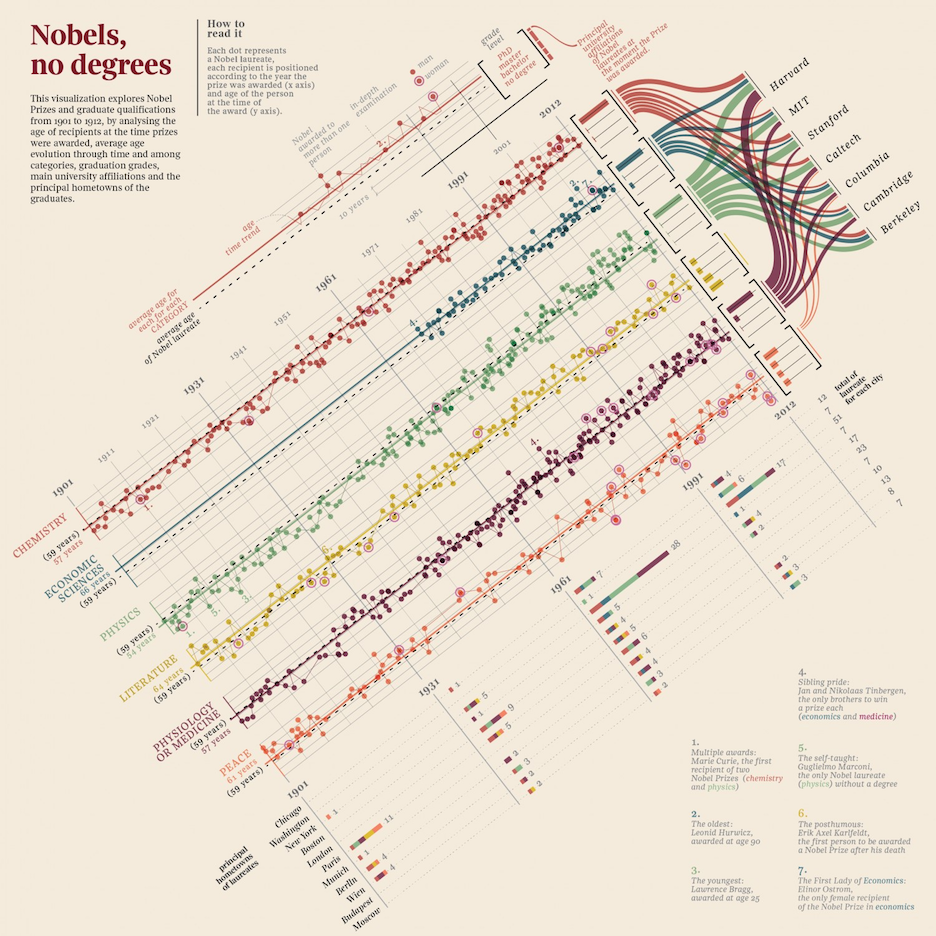
Visualization B
http://visual.ly/nobels-no-degrees-english

4. Design Creation (2 points)
Create 5 sketches to visualize the following data and name and describe the visual variables you are using to encode the information:

Scan your sketches and create a PDF (creation.pdf) with all results.
5. Bonus Task (1 points)
Please make sure to finish all the previous tasks before you start with the bonus activity. Extra credit is only given if the rest of the homework has been completed and the full possible points have been received. This task is intended for those of you who already have more experience with HTML, CSS and JS.
You are currently showing overall statistics and a bar chart on your website. Whenever the user changes a selection, the corresponding dataset will be filtered and the views are getting updated. In this bonus task you should extend the dashboard with a sortable table view to show the individual customer feedbacks.
Column names:
- Delivery ID
- Area
- Time [min]
- Driver
- Number of pizzas
- Punctuality
- Quality
- Wrong Pizza
You should also connect the table with the select-boxes and your update mechanism. If the user selects Boston and Phone, the rows should be filtered accordingly.
You can use the same script as in HW1 to make your table sortable: http://www.cs171.org/2018/assets/scripts/hw1/sorttable.js (Hint: use the class name ‘sortable’)
6. Submit Homework in Canvas
a. Put your JS homework in the folder structure ‘submission_FirstnameLastname/hw/implementation’.
b. Put your 2 PDF files (design critique and design creation) in the folder structure ‘submission_FirstnameLastname/hw/design’
c. Zip your folder and upload it on Canvas for your homework submission.
Use the following recommended folder structure:
/submission_FirstnameLastname
	hw/
	    implementation/
   	        index.html
	        css/ 		...folder with all CSS files
	        js/ 		...folder with all JavaScript files
	    design/
	        critique.pdf
	        creation.pdf
	    ...
Note that you should add your name to the filename using CamelCase style, e.g., submission_JohnDoe.zip if your name is John Doe.
Congratulations for finishing Homework 2! See you in class!